As a trader, your #1 goal is to keep your current trading capital safe and secure. Your goal as a a trader is to make money and not lose money. Many new traders lose their trading capital in the first year, but these ten tips will help you keep your capital intact so you can make it grow.
Do not start trading until you have fully educated yourself. Trading tuition is expensive when you trade first and learn later.
Do not trade an account so small that commissions will end up being a big drag on your returns.
Do not trade until you have a well developed trading plan.
Trade a position size that does not cause your emotions to become so loud you can’t hear your trading plan.
Only trade in markets you fully understand.
Only take valid entry signals and do not chase. Let your entry point trigger first.
Only trade in liquid markets so bid/ask spreads do not devour your account.
Never risk losing more than 1% of your total trading capital on any one trade through proper position sizing, and by placing stop losses at the correct price levels.
Never expose your total trading account to more than a 3% loss of total trading capital at any one time, on one day.
Never move a stop loss. Take the exit the first time it is triggered.
Rather, it’s reading the sentiment of the markets, identifying areas of value, and trading along the path of least resistance.
And yes, price action trading can be complemented with indicators. It’s about understanding your trading tools and knowing how to apply it effectively.
So, in today’s lesson…
You’ll learn 10 price action trading tips that will improve your trading performance immediately.
Ready?
Then let’s begin.
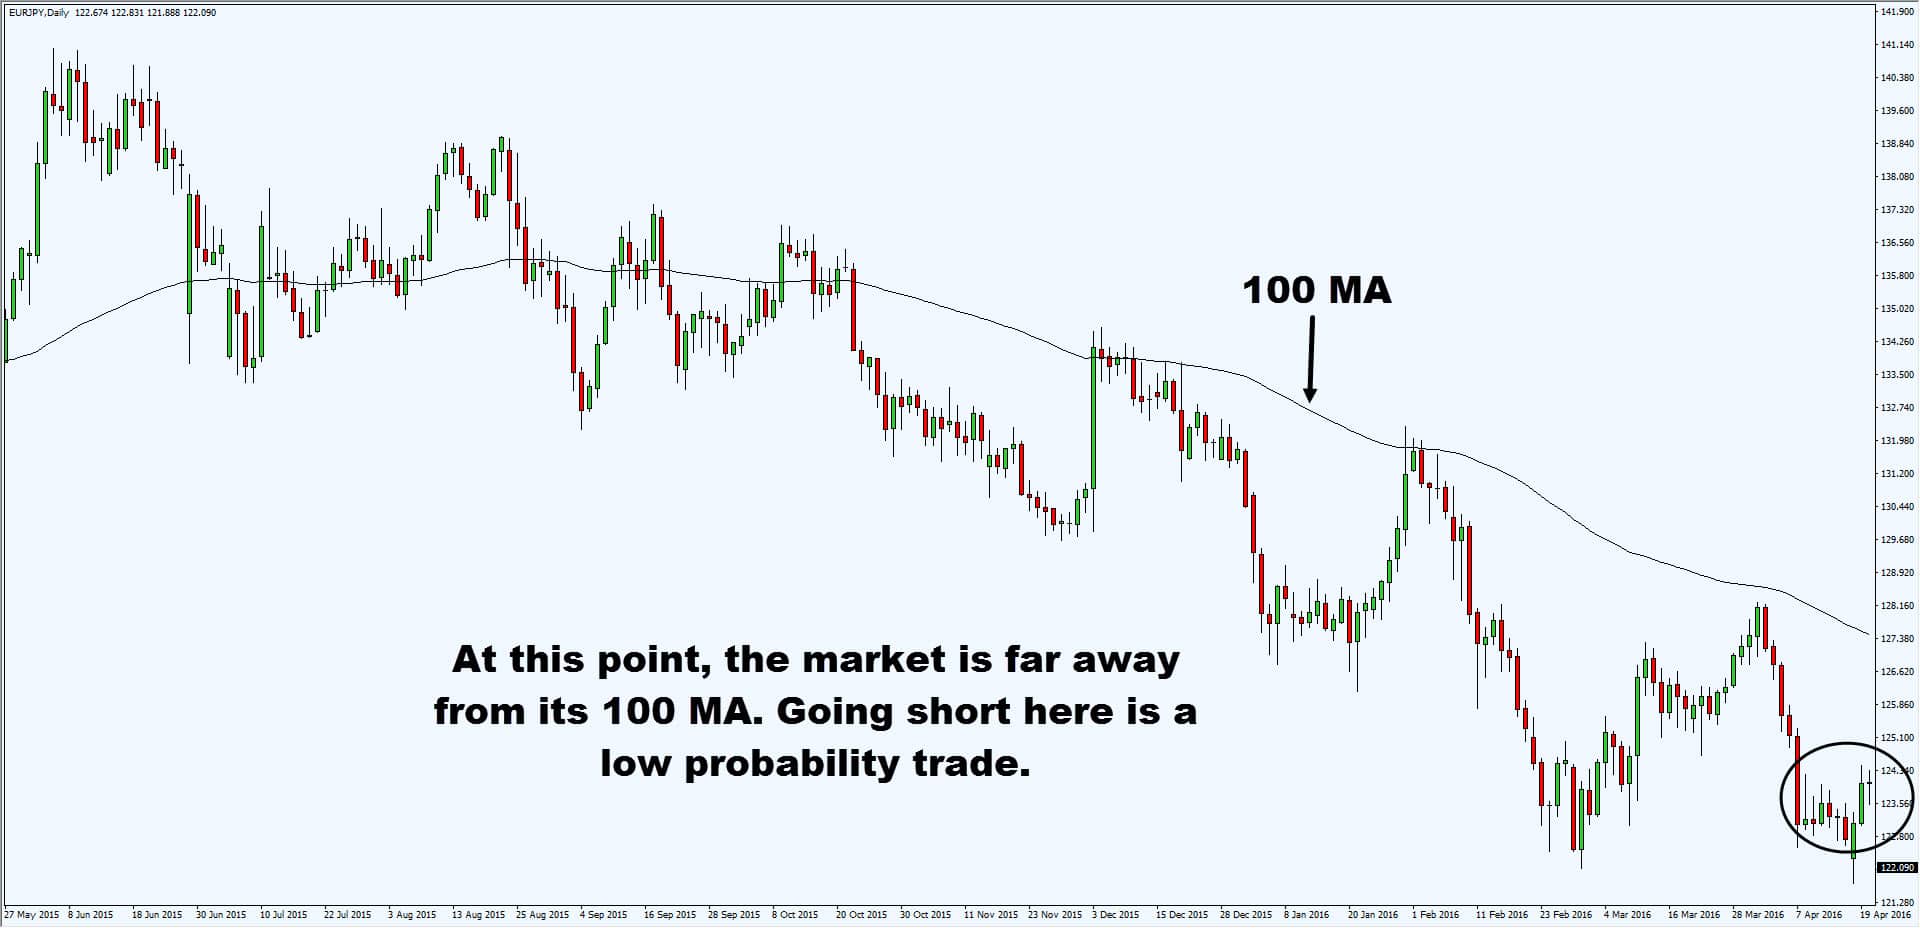
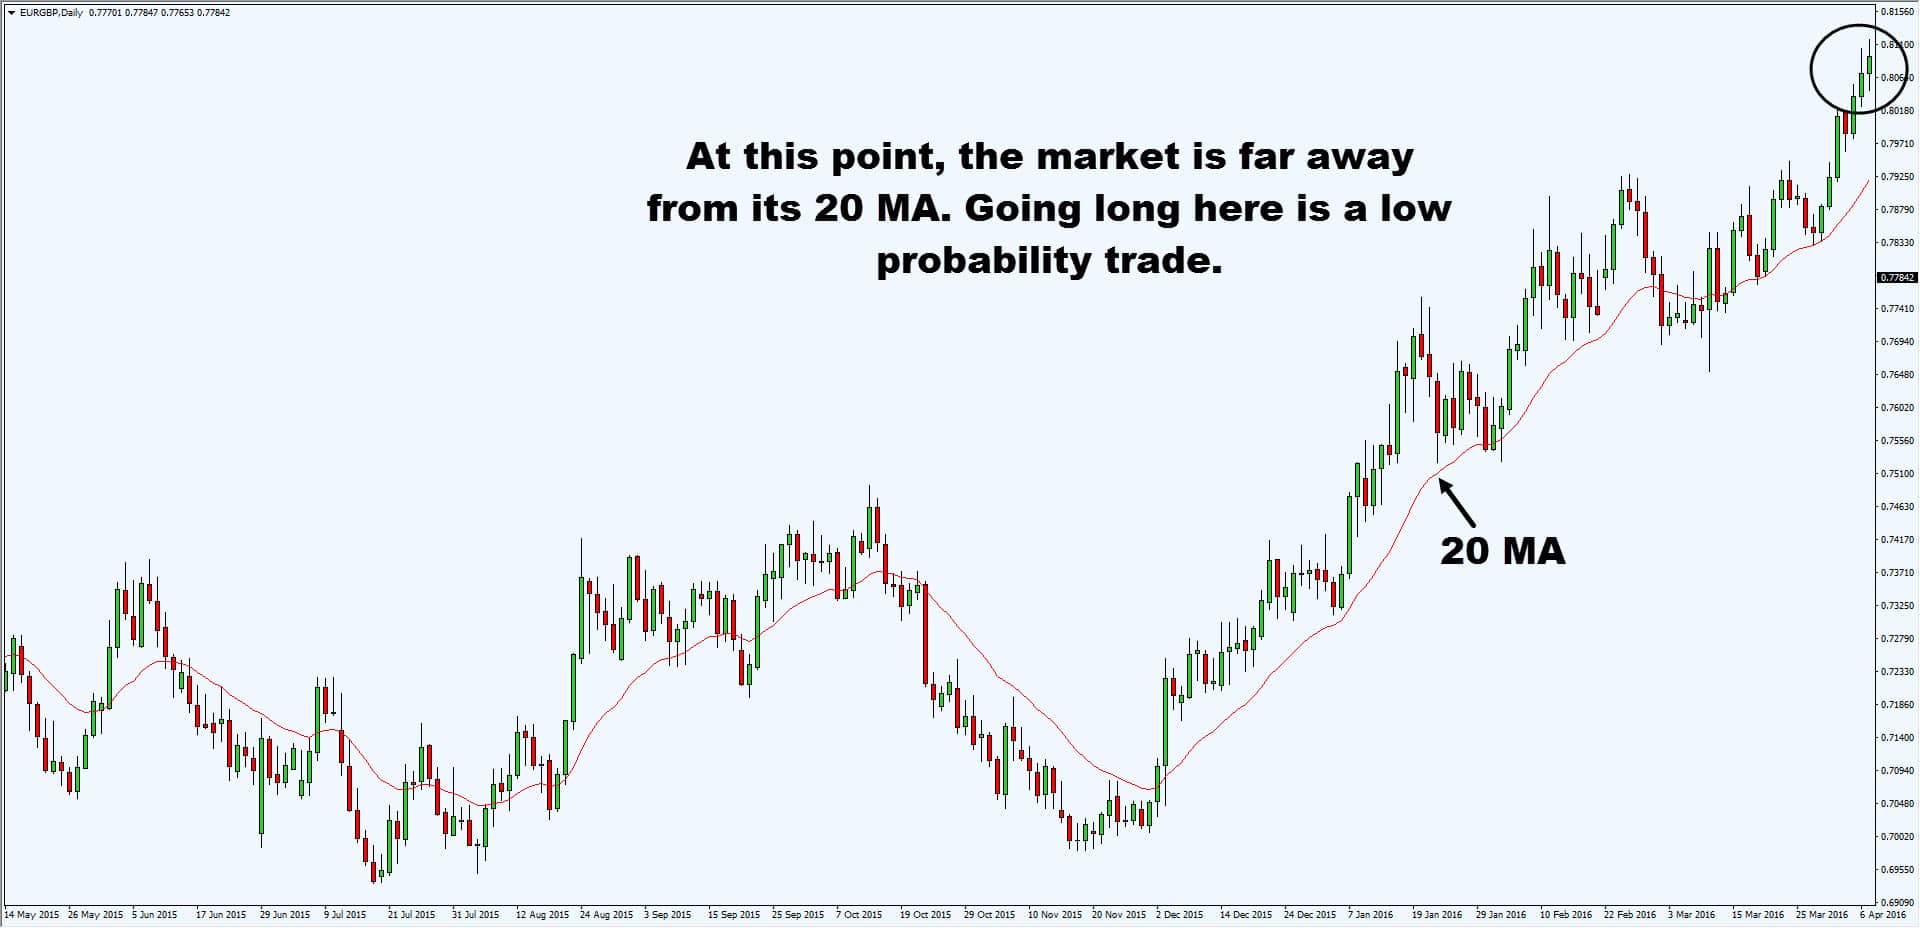
1. Avoid trading when the market is far away from the moving average
When the market is trending, it tends to mean revert towards the moving average.
Depending on the type of trend you’re in:
In a strong trend, the market tends mean revert to the 20 MA.
In a normal trend, the market tends to mean revert to the 100 MA
In a weak trend, the market tends to mean revert to 200 MA
Thus, the last thing you want to do is enter a trade when the market is far away from it’s moving average.
Here’s what I mean:
Pro tip:
You need to identify the moving average that is currently being “respected” by the markets.
In a strong trending market, the moving average value is lower, and in weak trending markets, the moving average value is higher.
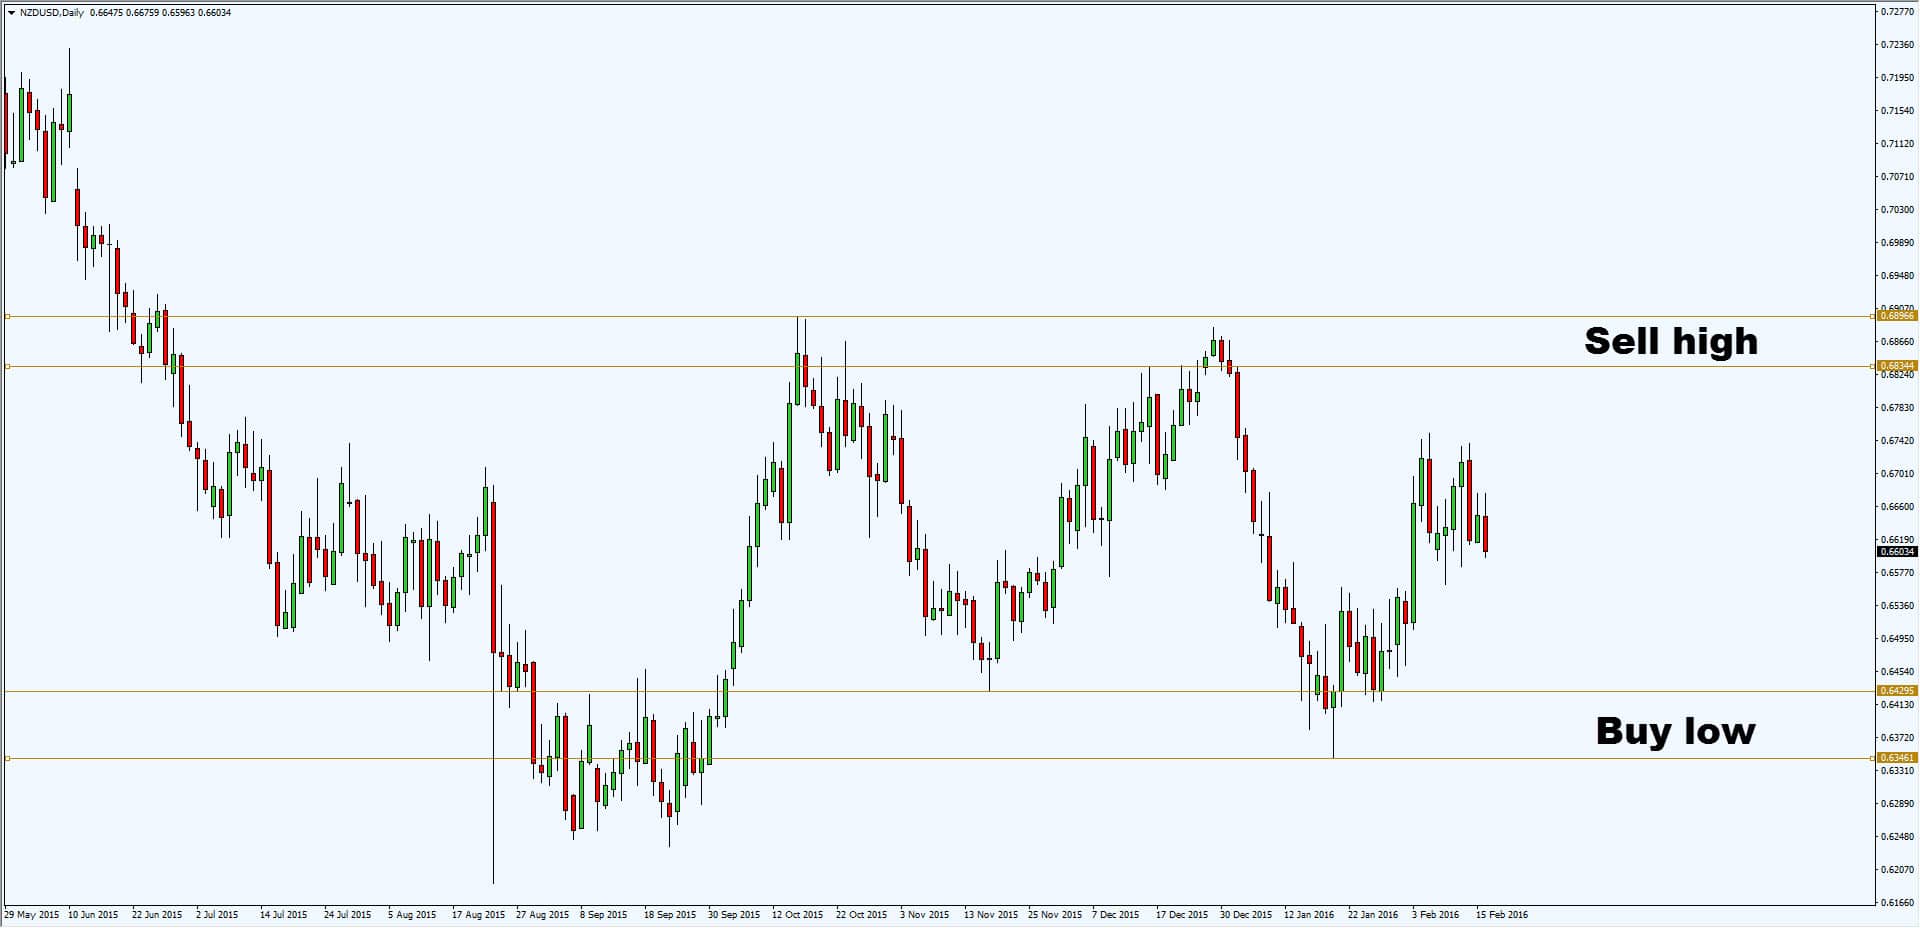
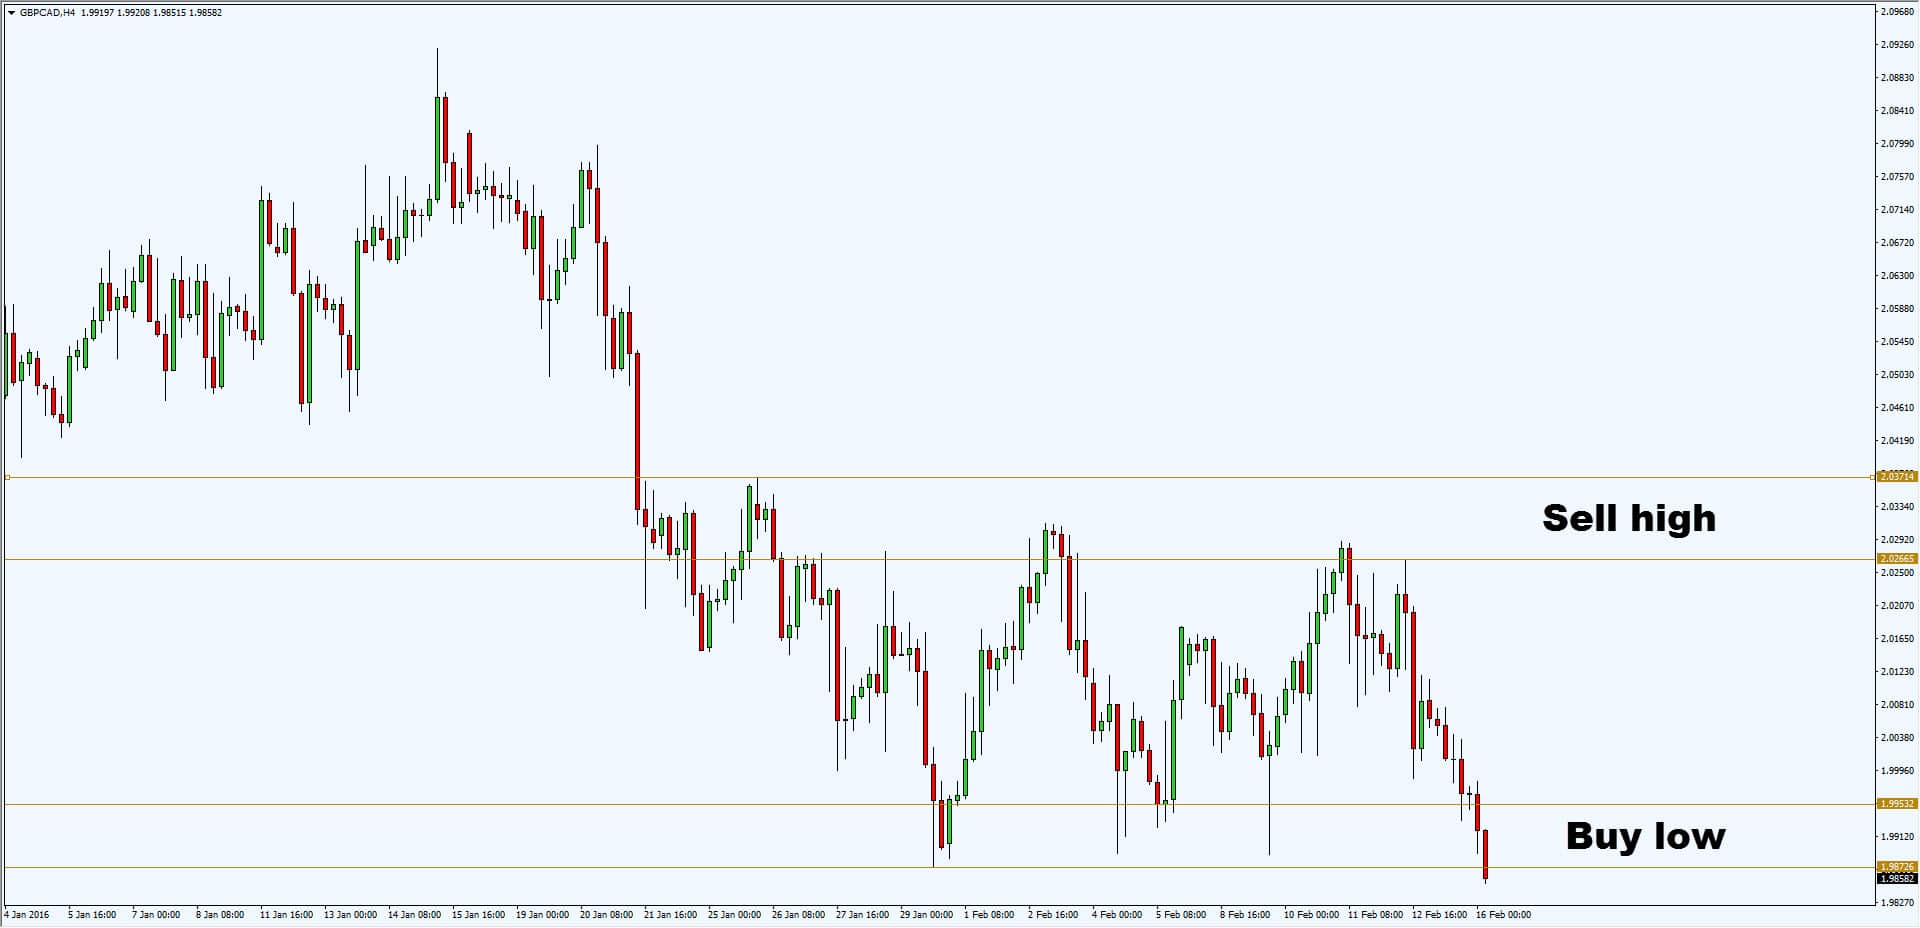
2. Support & resistance helps you identify areas of value to trade from
You want to buy low and sell high, right?
But the question is:
How do you define what’s low and what’s high?
Allow me to introduce to you…
Horizontal support & resistance
This is useful because it helps you identify areas of value on the chart.
Support – Area on the chart where you’re are looking to buy “low”
Resistance – Area on the chart where you’re looking to sell “high”
Here are a few examples:
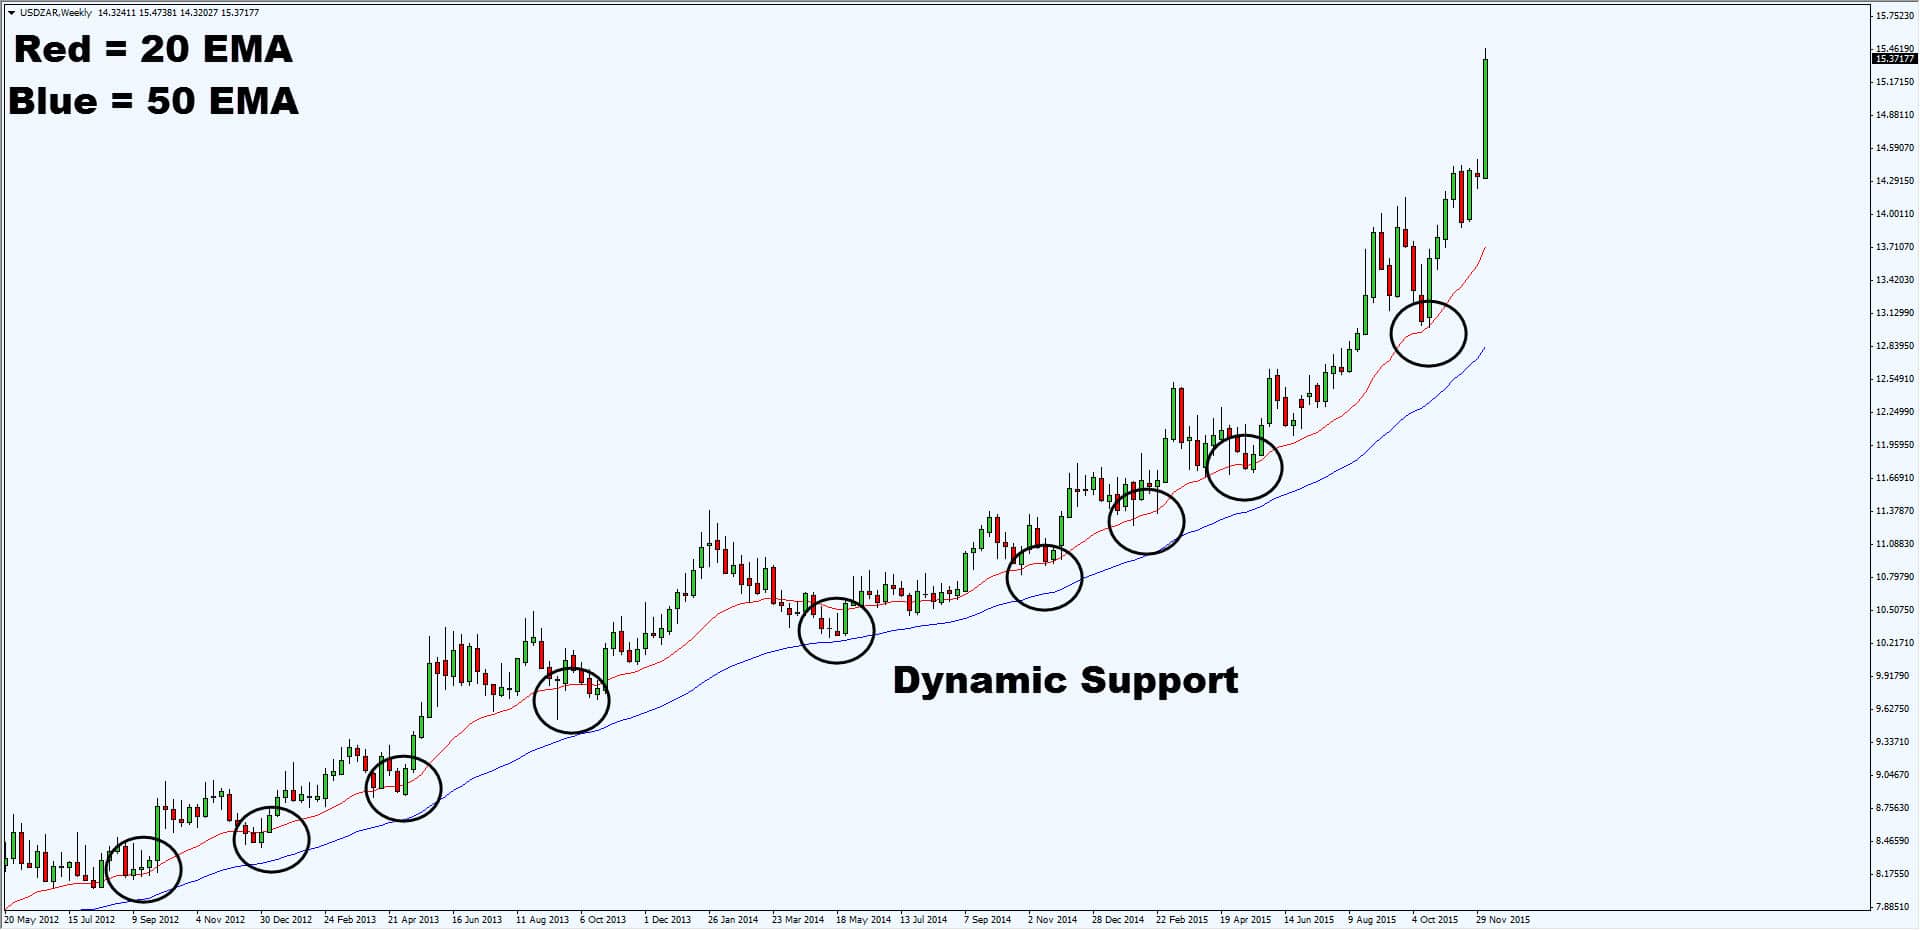
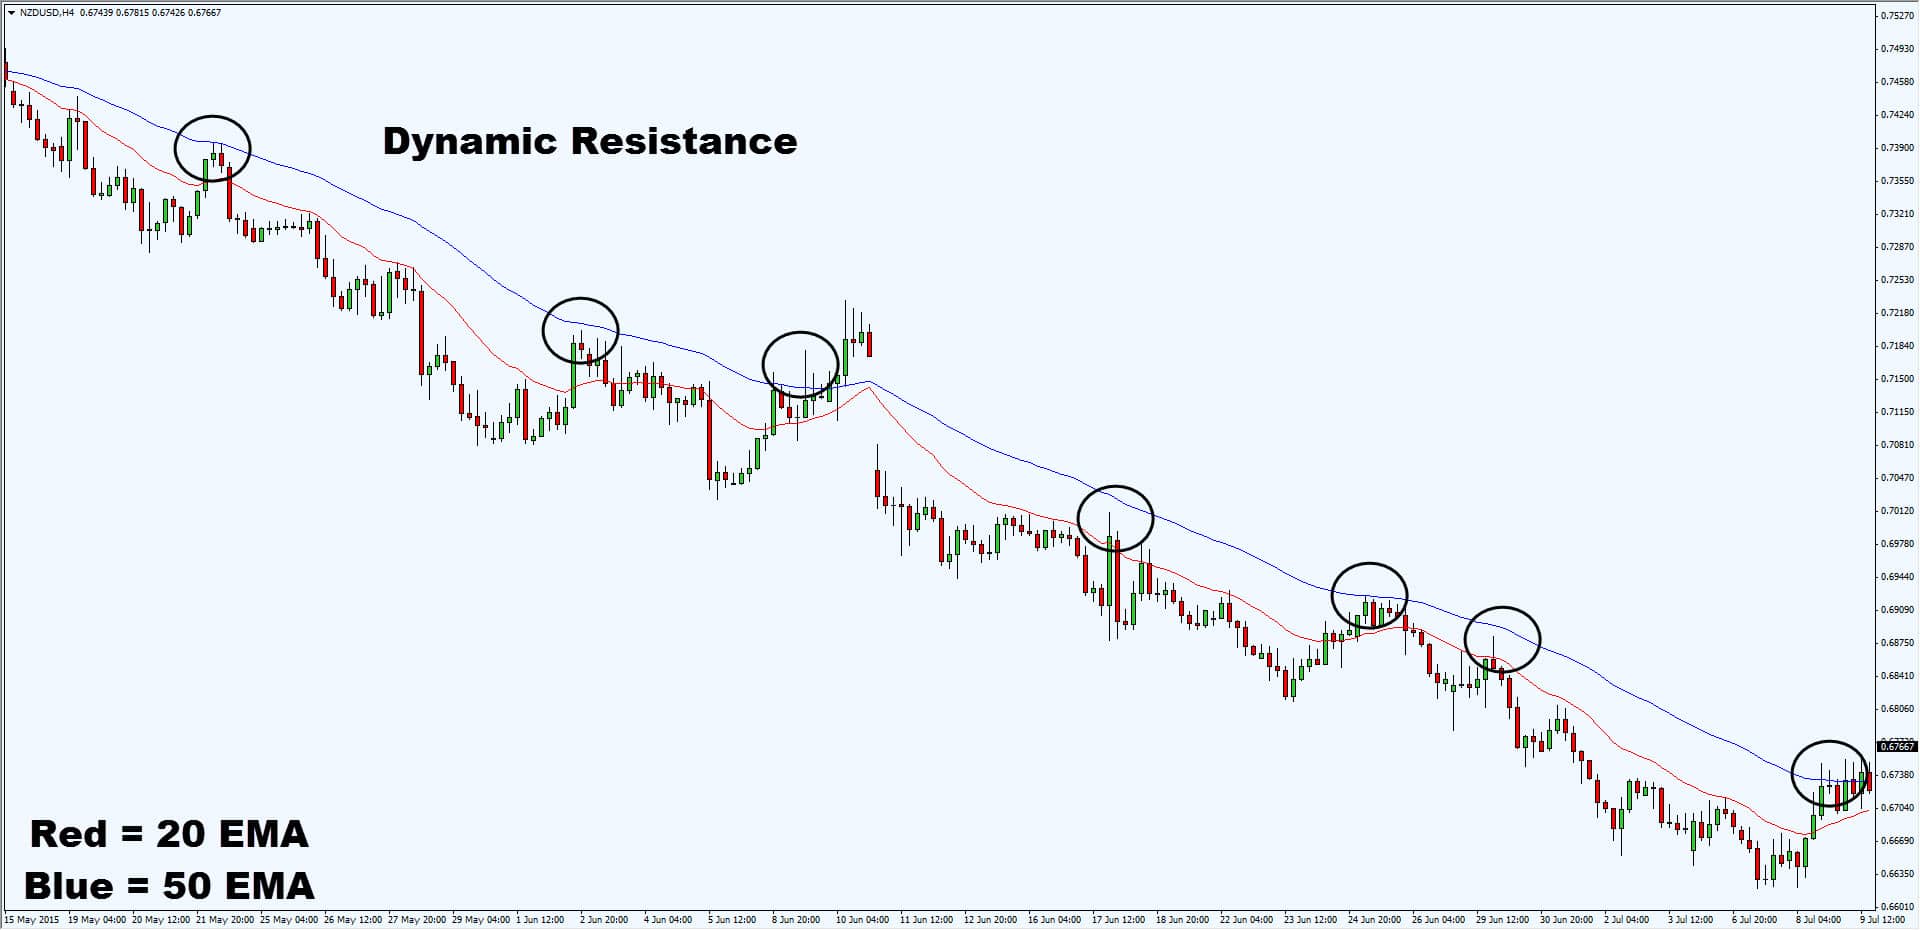
Also, moving average helps you identify areas of value in the form of…
Dynamic support & resistance
These are Support & Resistance that moves along with the price.
Dynamic support occurs in an uptrend, and dynamic resistance in a downtrend.
They can be identified using moving averages. (I use 20 & 50 EMA).
This is what I mean…
Pro tip:
In a strong trending market, the price may not pullback towards horizontal support & resistance (which cause a lot of traders to miss the trend).
Instead, they tend to pullback towards dynamic support & resistance, which is an area of value you must pay attention to.
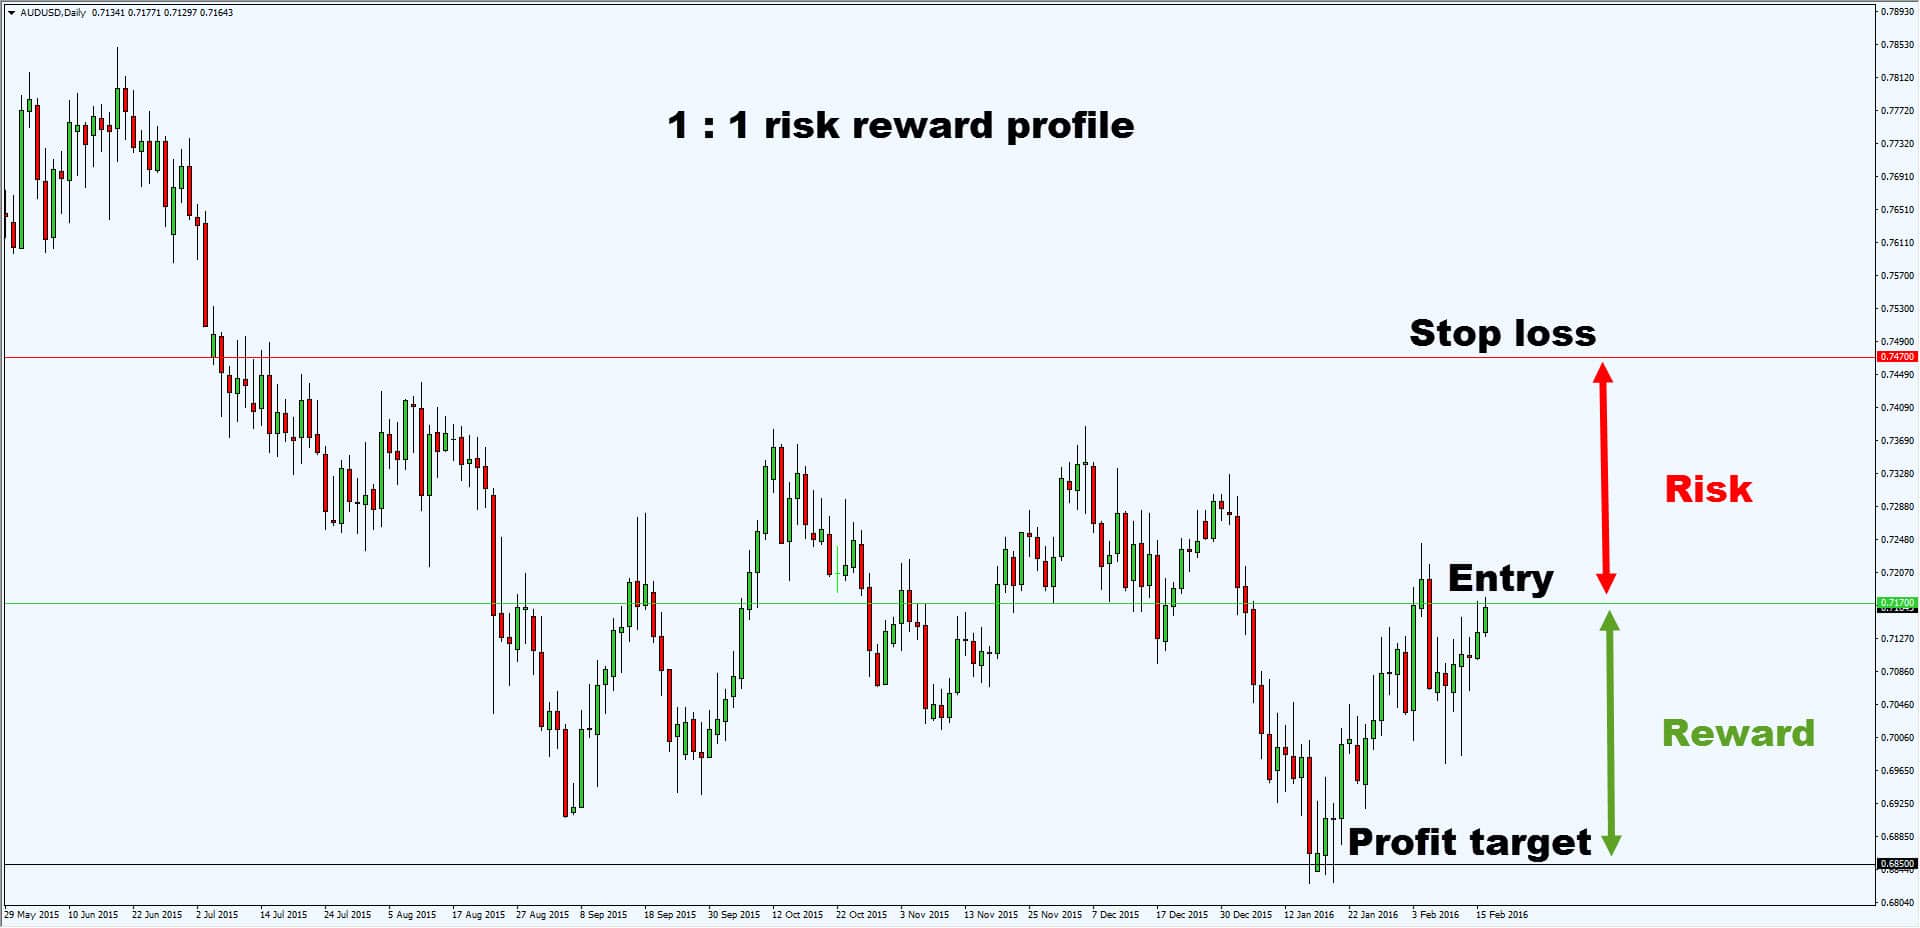
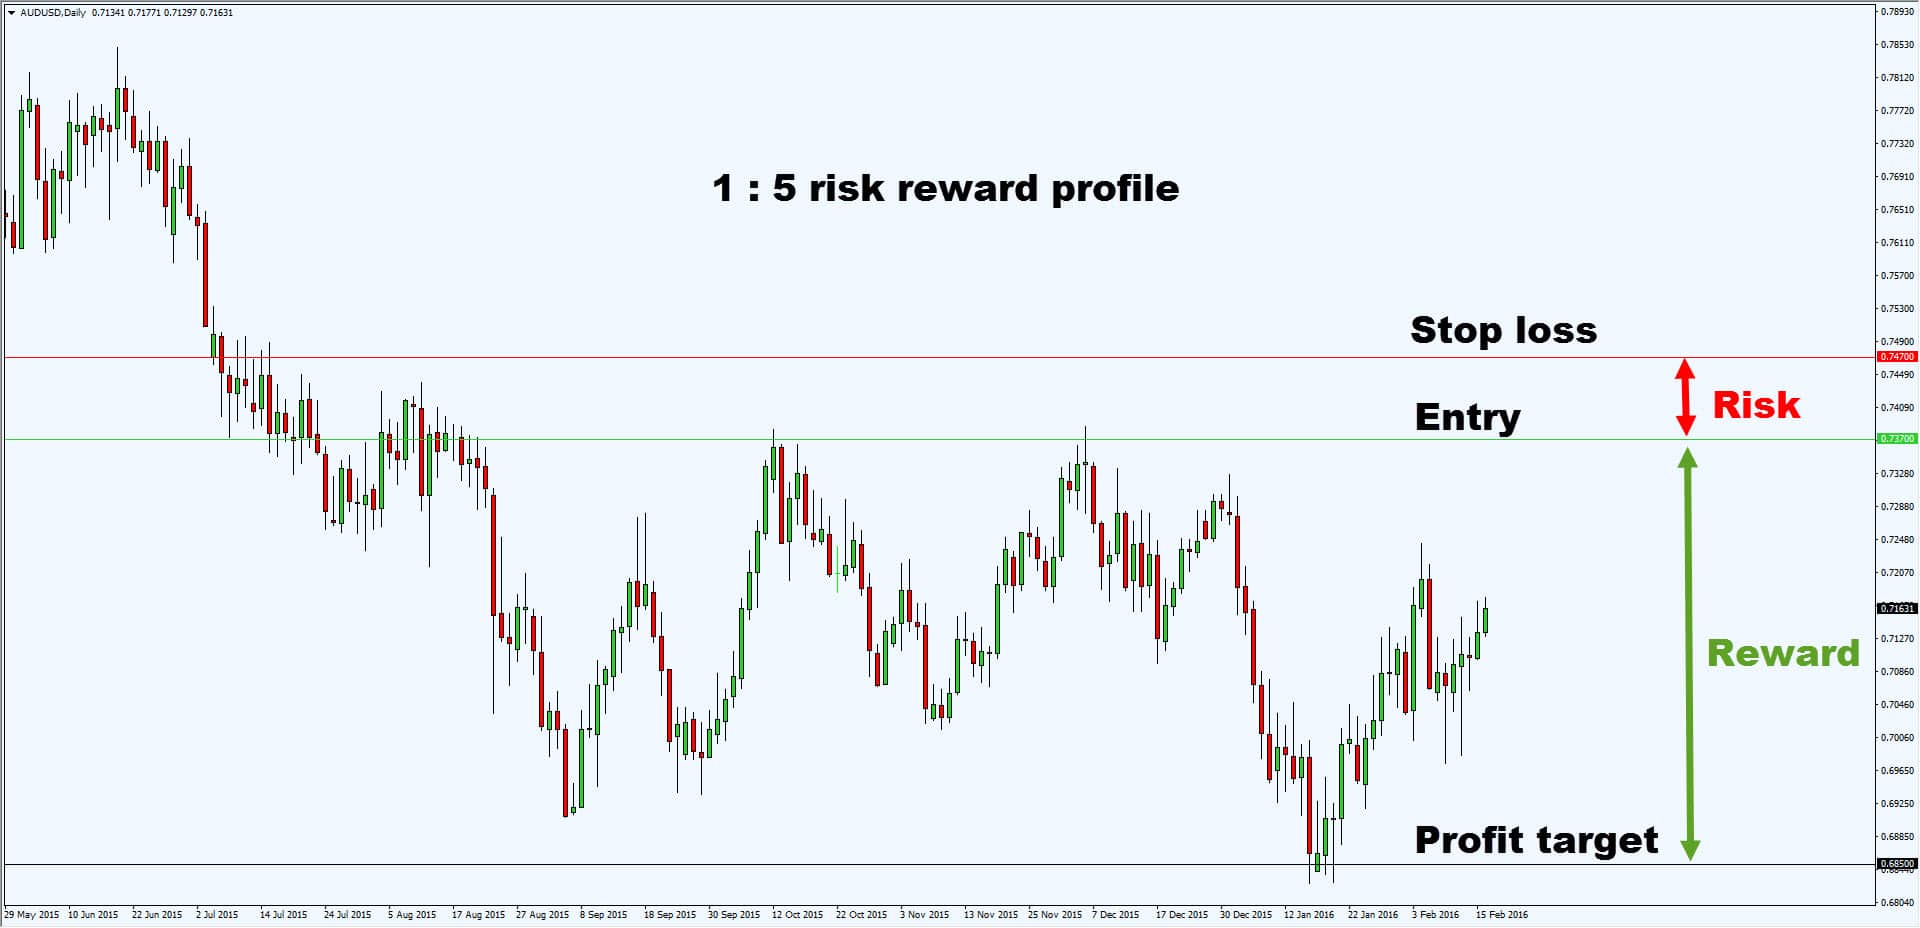
3. Trading at support & resistance gives you favorable risk to reward
Here’s the thing…
If you enter trades in the middle of a range, it never gives you a favorable risk to reward (at best 1 to 1).
An example:
But…
If you enter trades at support & resistance, it would greatly improve your risk to reward.
Here’s what I mean:
Pro tip:
The risk to reward profile is only one side of the equation. The other thing you need to take into account is the probability of your trade working out.
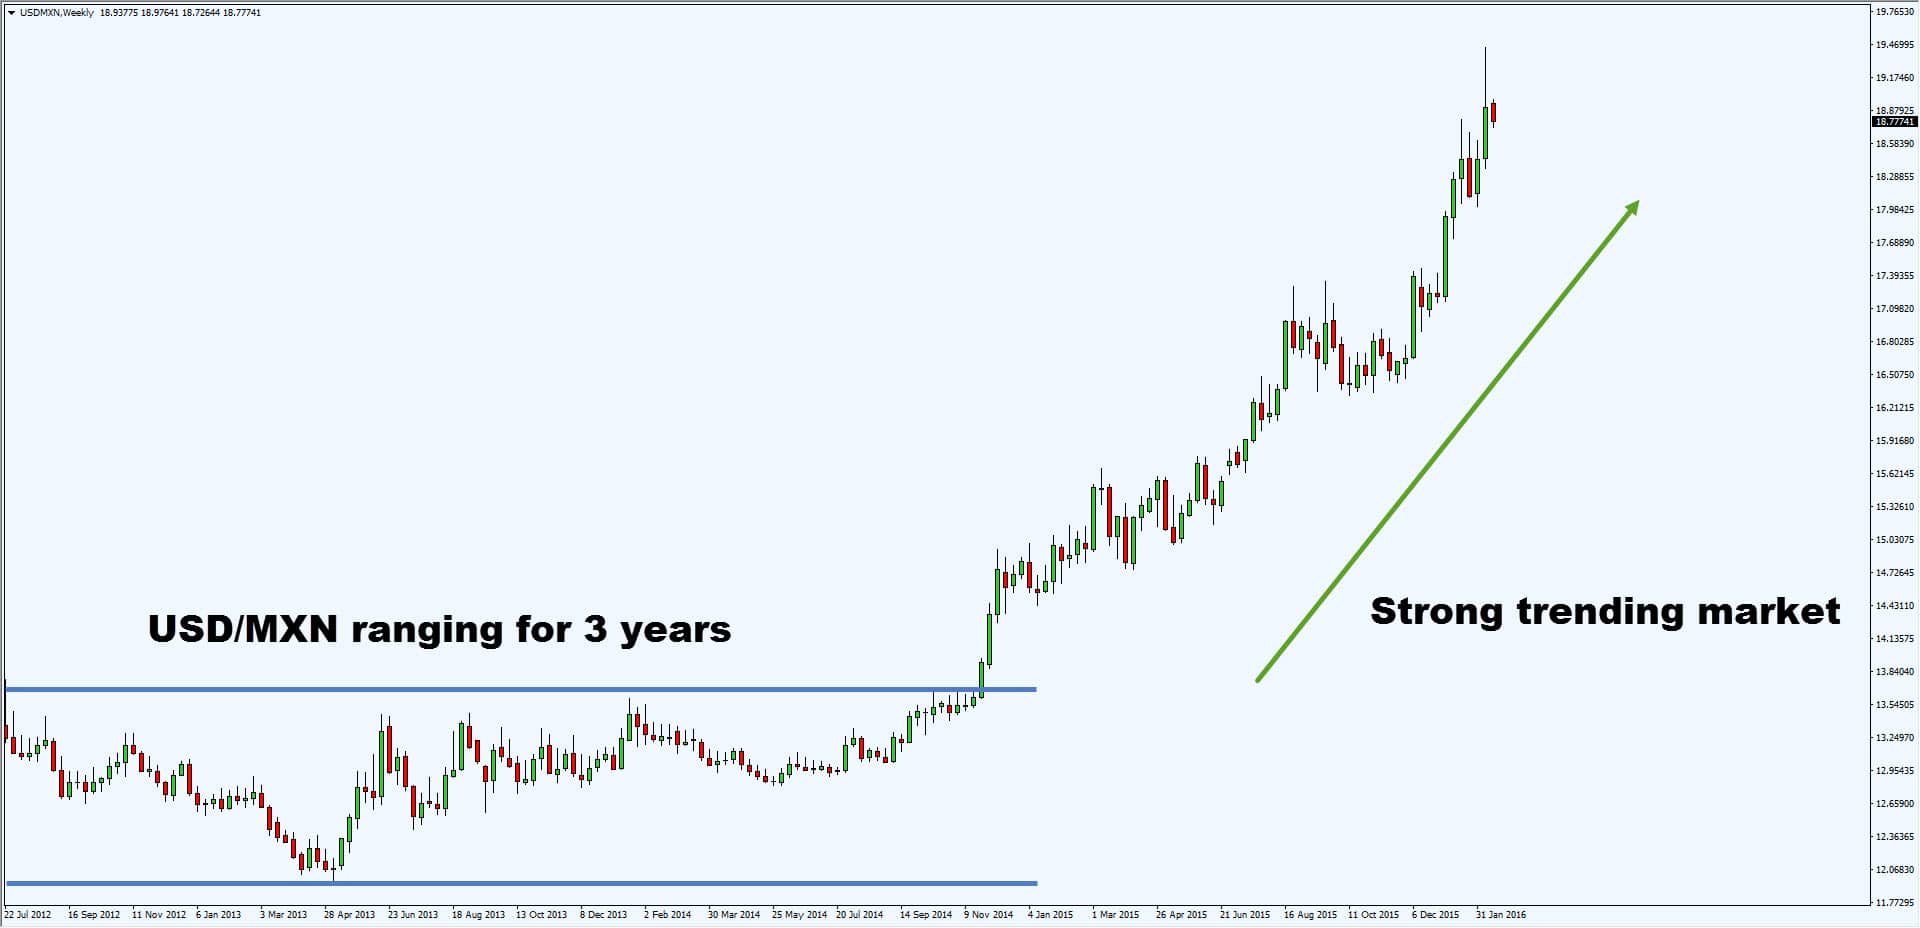
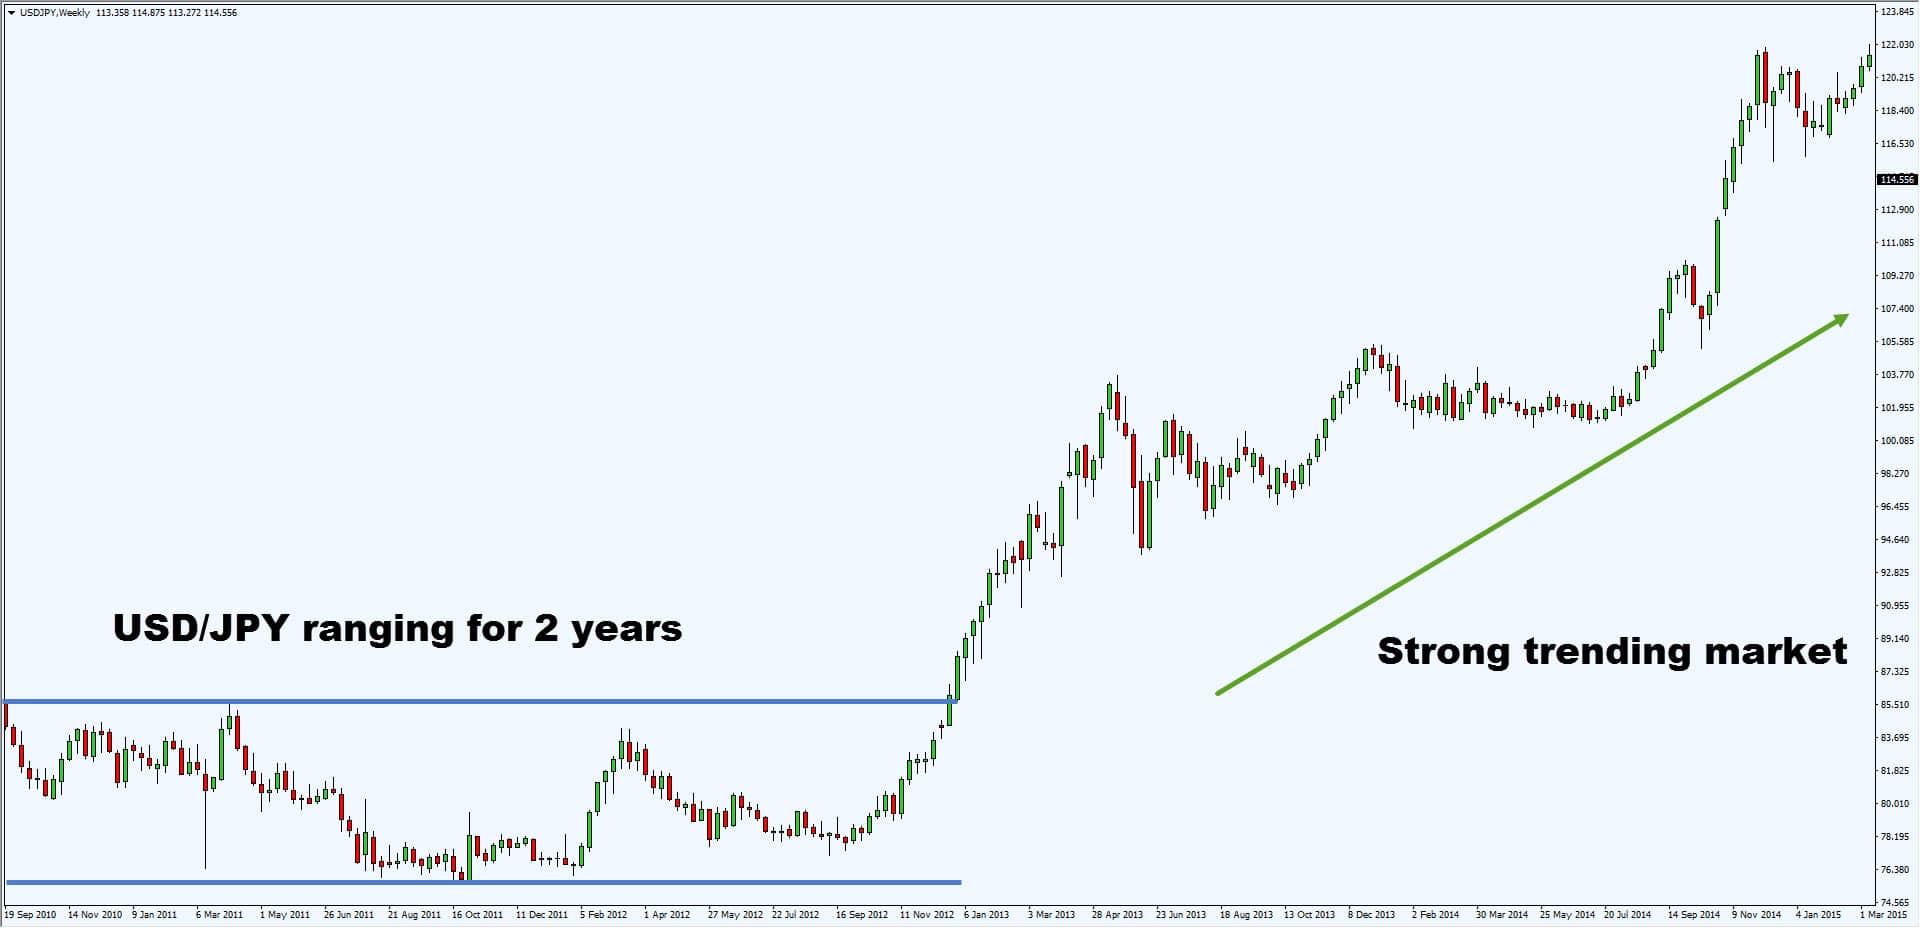
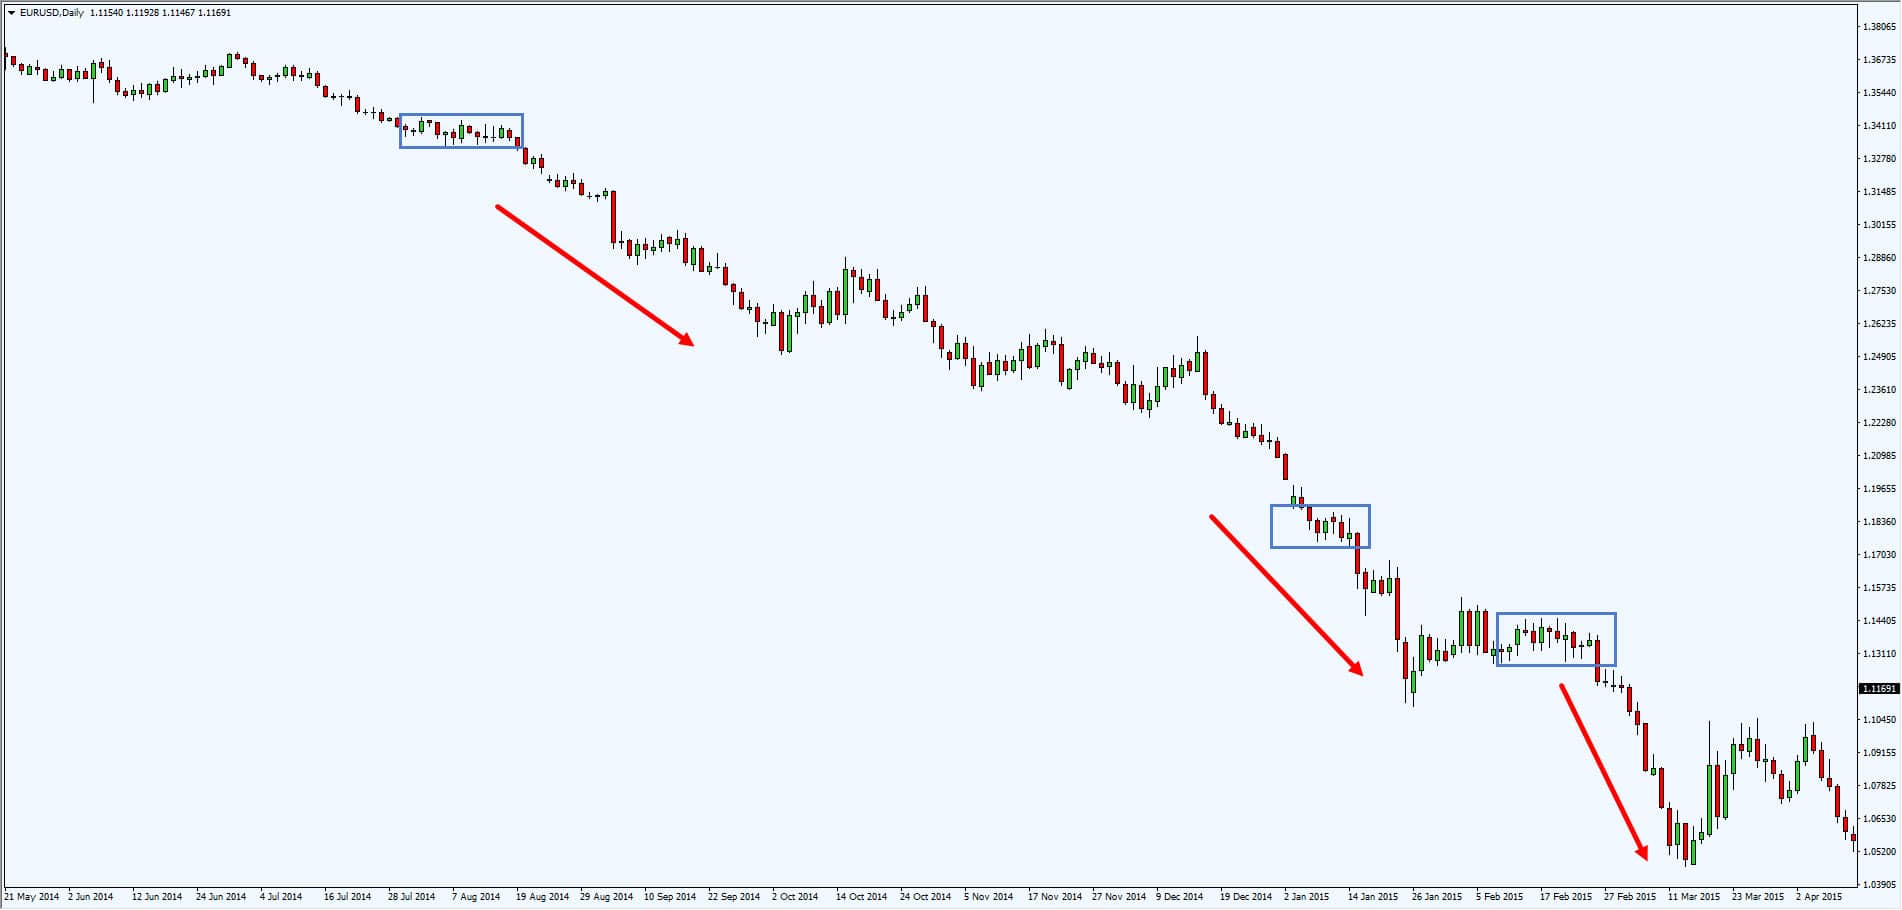
4. The longer it ranges the harder it trends
If there is a sudden range expansion in a market that has been trading narrowly, human nature is to try and fade that price move. When you get range expansion, the market is sending you a very loud, clear signal that the market is getting ready to move in the direction of that expansion. – Paul Tudor Jones
If you notice the price has been ranging for a long time, you’re not alone.
Traders all around the world will be seeing the same charts as you.
Some will be queuing to short the resistance, and some will be trading the breakout.
If the price does trade above the resistance, shorts will get squeezed, and breakout traders will hop on the bandwagon.
That’s why price trend for a sustained period of time, due to the imbalance of buying/selling pressure.
Here are a few examples:
You’re probably wondering:
I don’t have the patience to wait this long. I want to capture big moves in the market, now.
And this is what I’ll cover next…
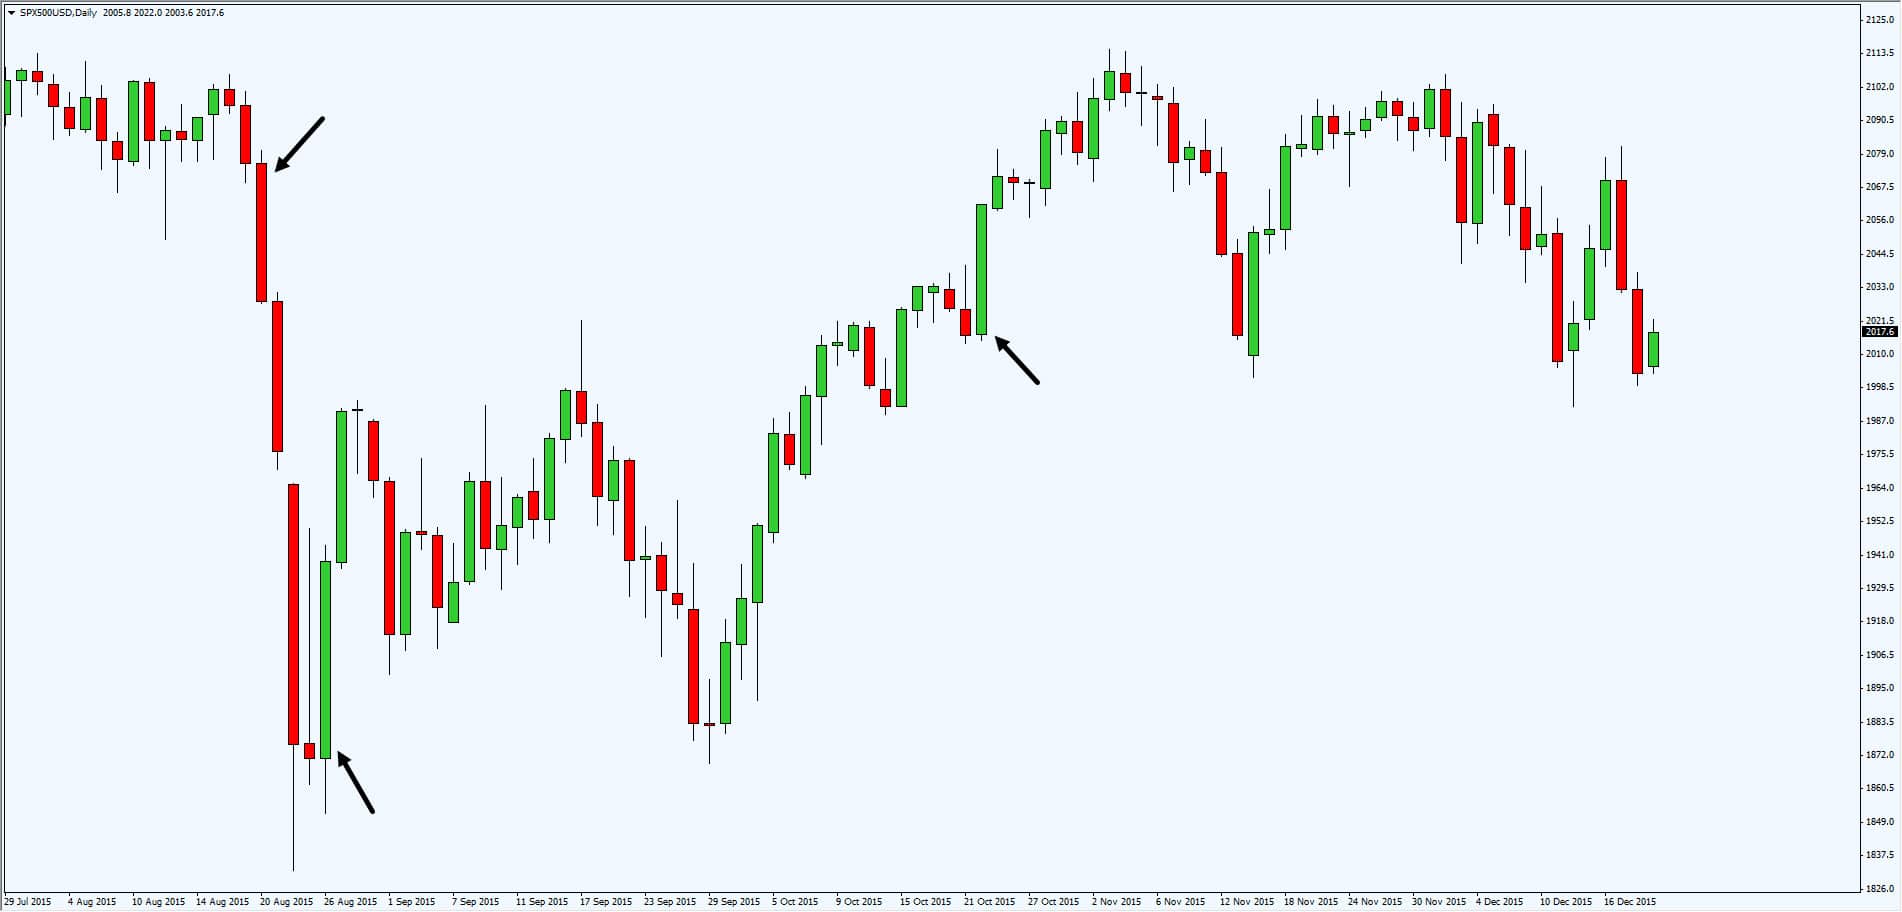
5. Narrow range candles usually lead to explosive moves
You’ve learnt that the longer price range, the harder it’ll trend. Now, you can take this concept further and apply it to the range of candles (instead of time).
The thing you’re looking out for is… narrow range candles.
Why?
Because you can expect an explosive move to occur soon.
Here are a few examples:
So, when you get series of narrow range candles, get ready for an explosive move.
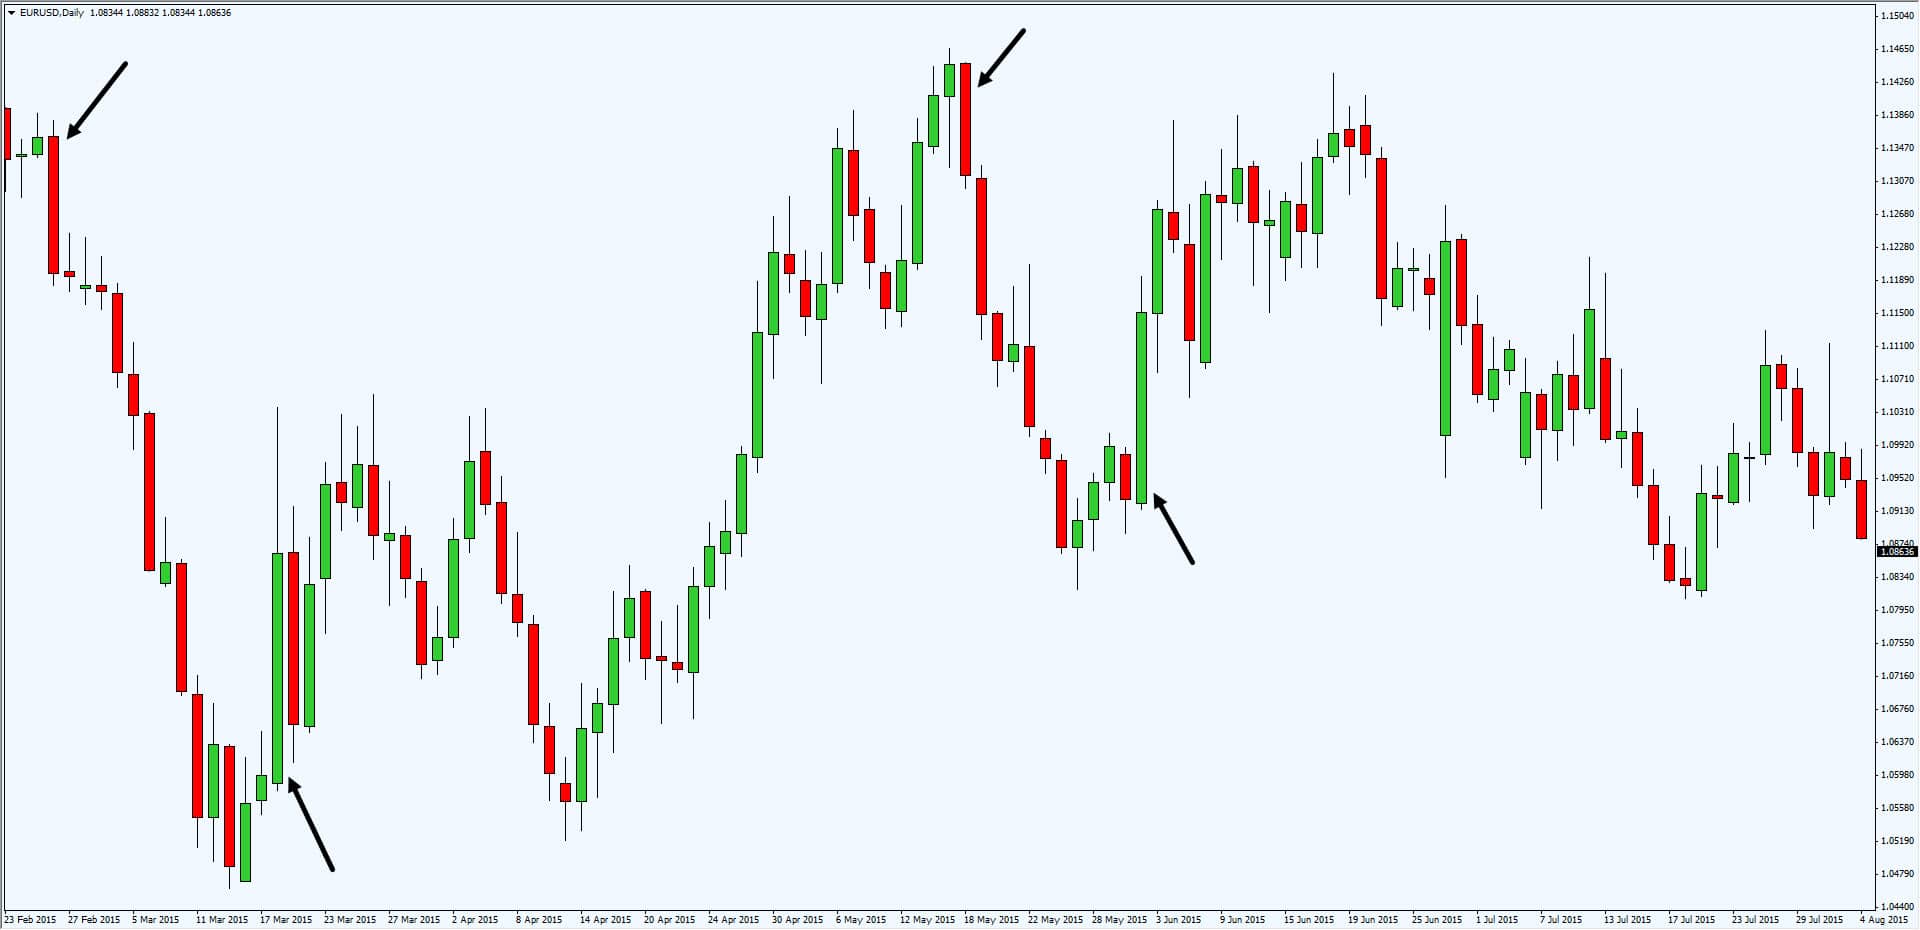
6. Wide range candles serve as “hidden” support & resistance
A wide range candle is formed due to an imbalance of buying/selling pressure.
This represents “hidden” Support & Resistance in the markets (known as Supply & Demand by Sam Seiden)
Here’s what I mean:
There are traders who swear by Supply & Demand, and some who do just fine, with Support & Resistance.
Here’s the thing…
You don’t want to trade them in isolation, but use them with other technical tools, that add confluence to your trades.
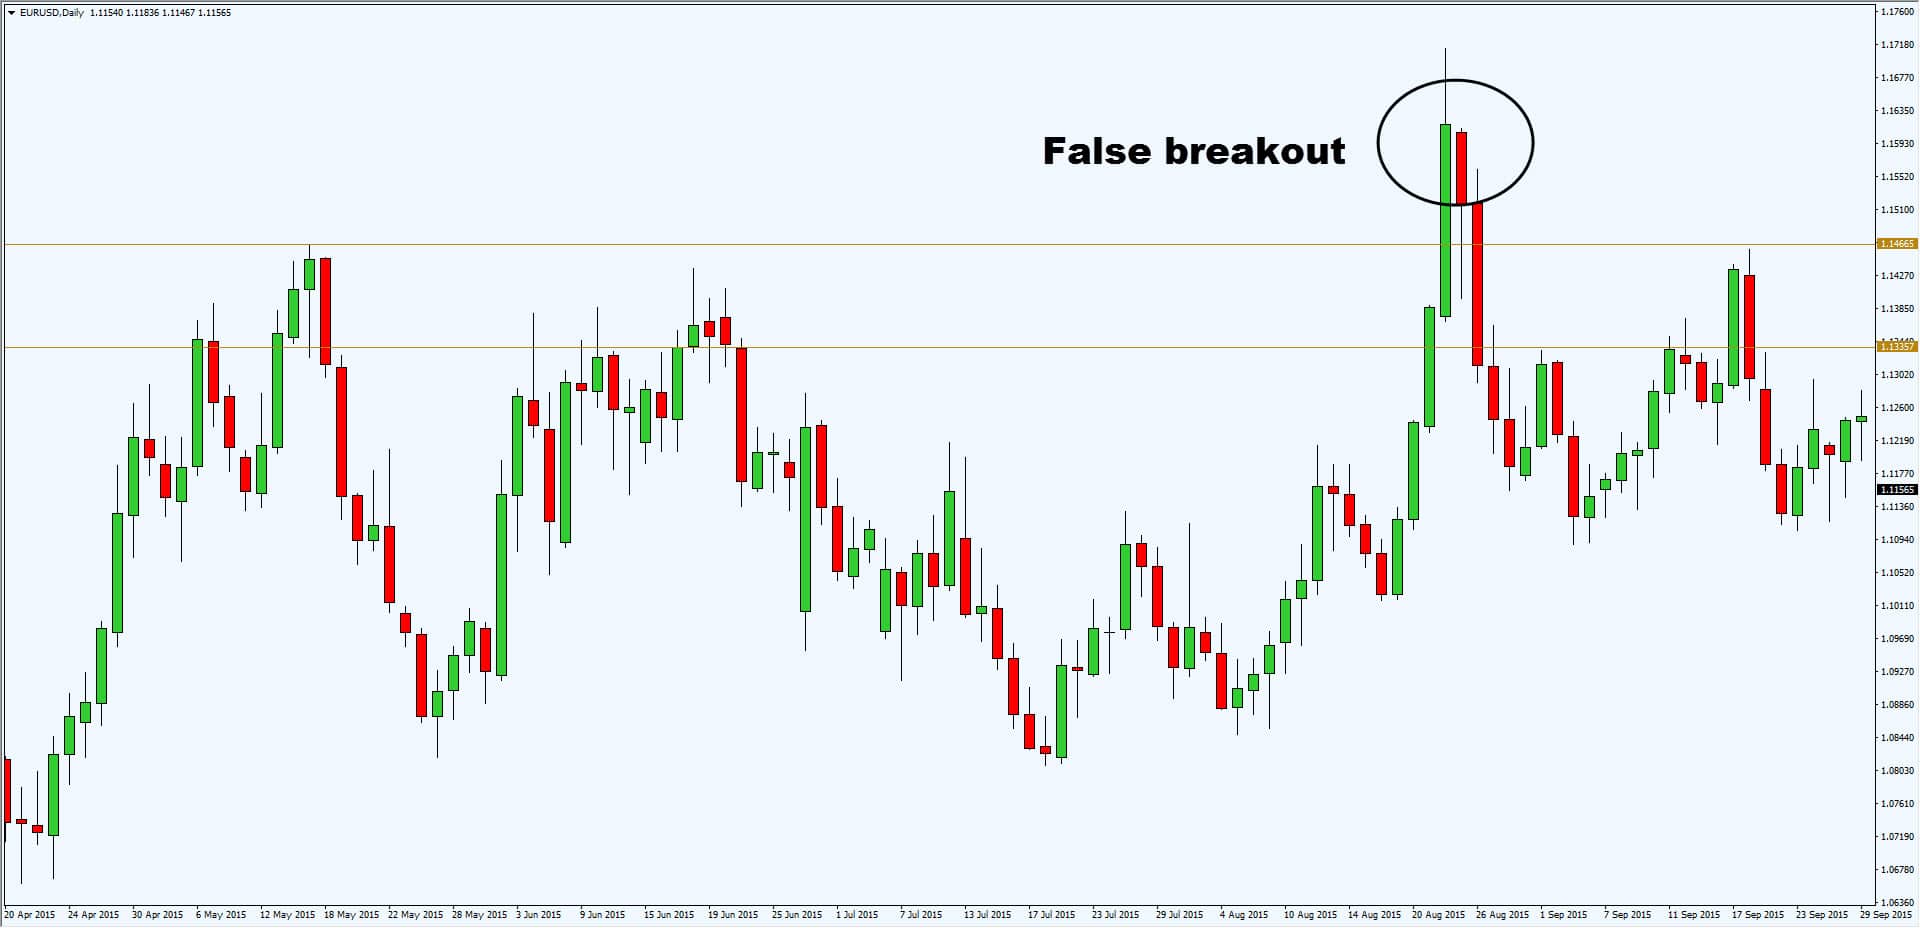
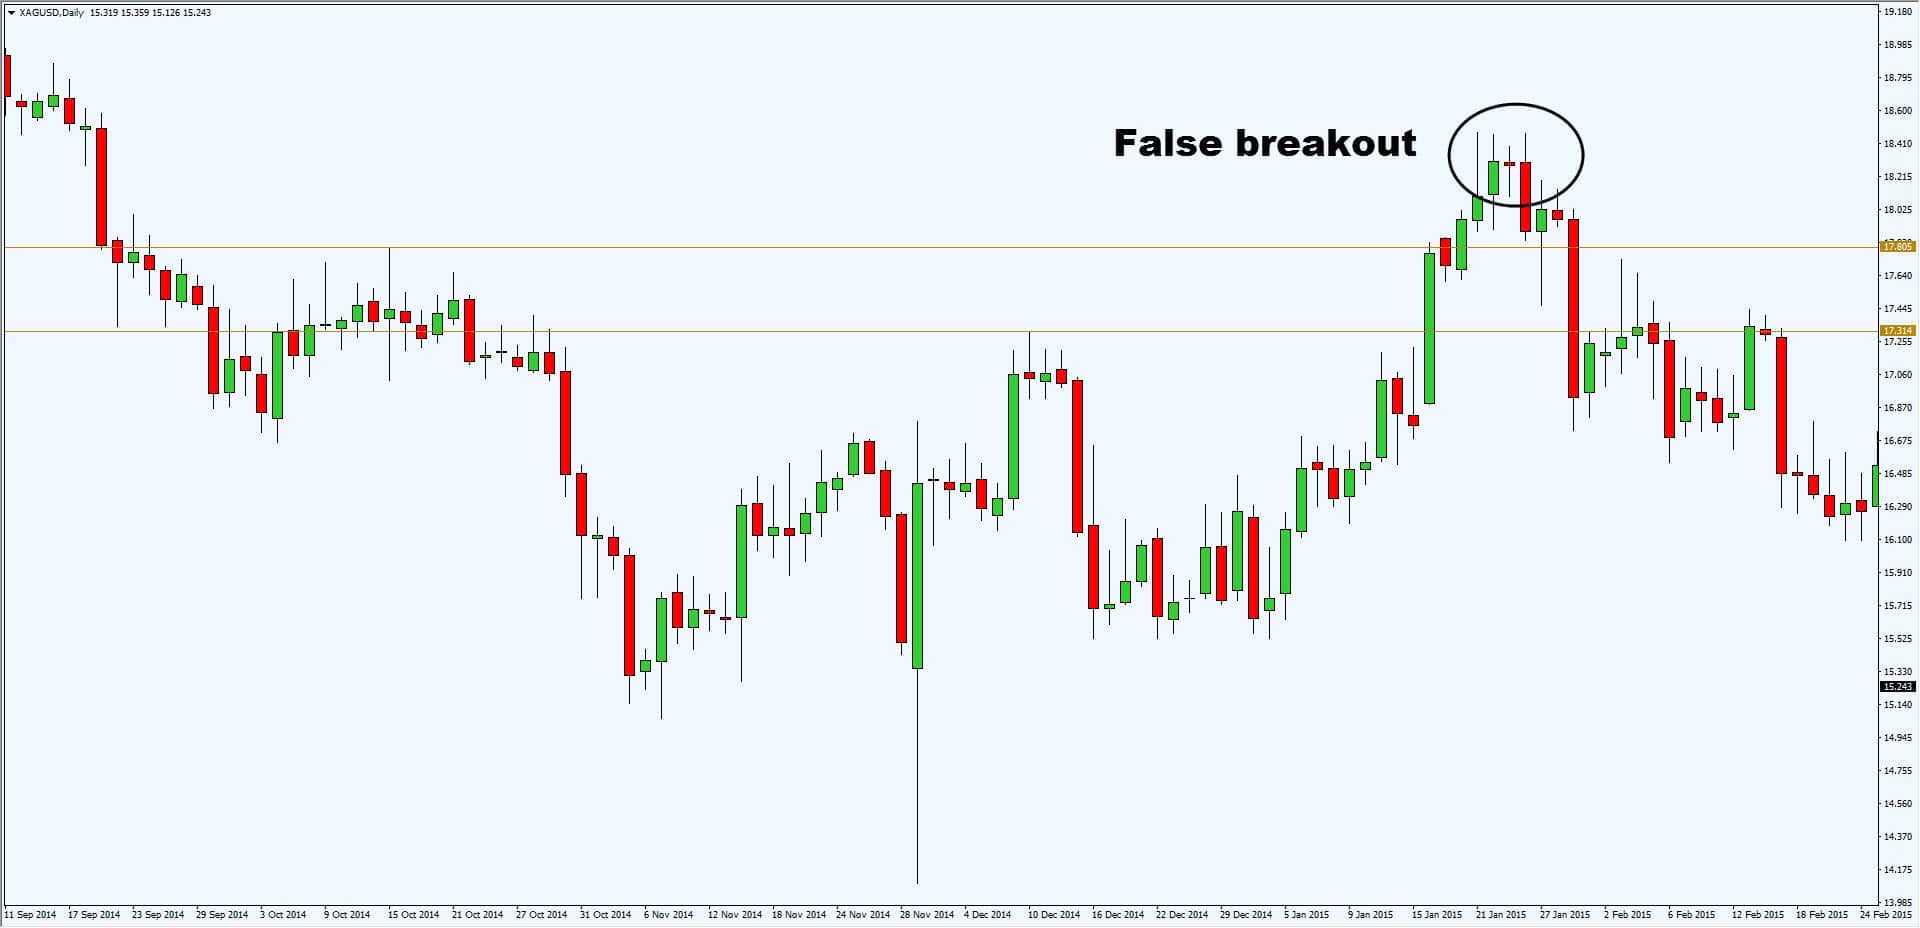
7. False breakout provides one of the best entry to profit from “trapped” traders
First, let me explain what is a false breakout.
I define false breakout when price breaks support or resistance, only to close back into the range.
Here’s what I mean…
Why is this one of the best times to enter a trade?
Because you’re taking advantage of traders who are being “trapped”.
Imagine:
A trader, called Michael, went long on the break of resistance because he expects a rally.
After a few candles, price traded against him and closed under resistance.
At this point…
Michael is “trapped”. And chances are, there are many traders like Michael, who took the same breakout trade and are “trapped”.
Now, a proficient trader can take advantage of this.
How?
By shorting the false breakout, with expectations that the “trapped” traders would cut their trade, and fuel further price decline.
And this my friend is the power of false breakout.
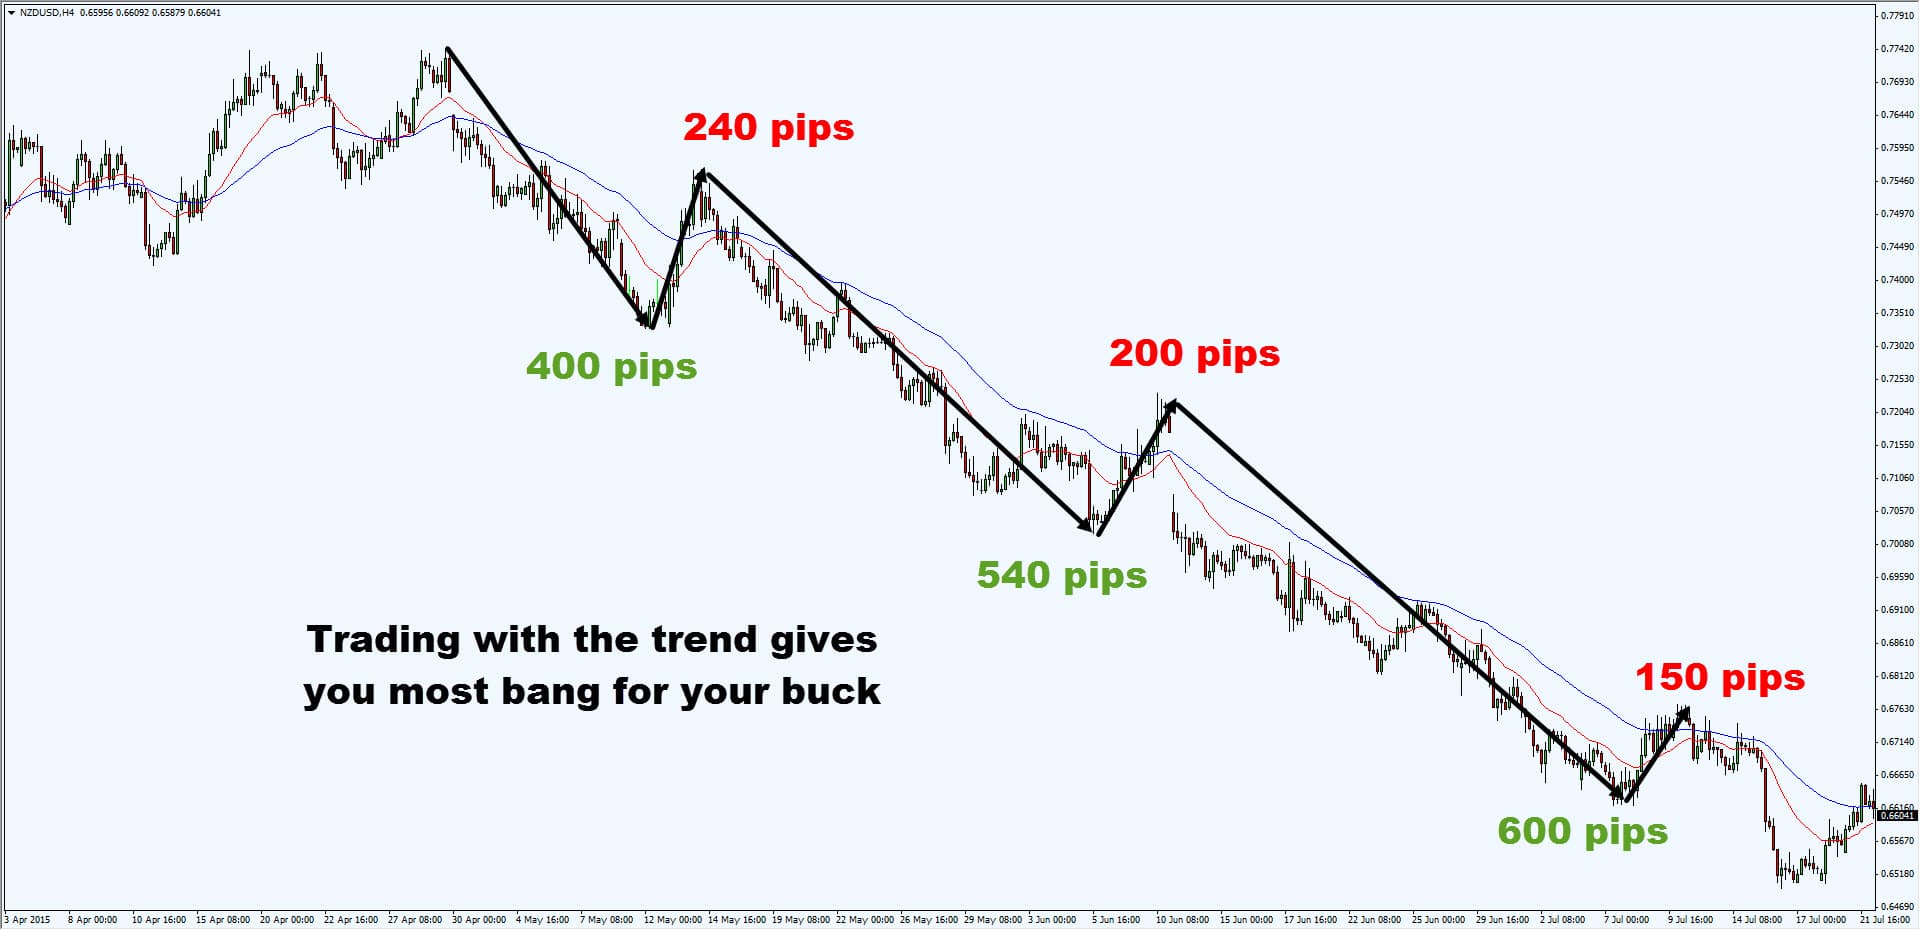
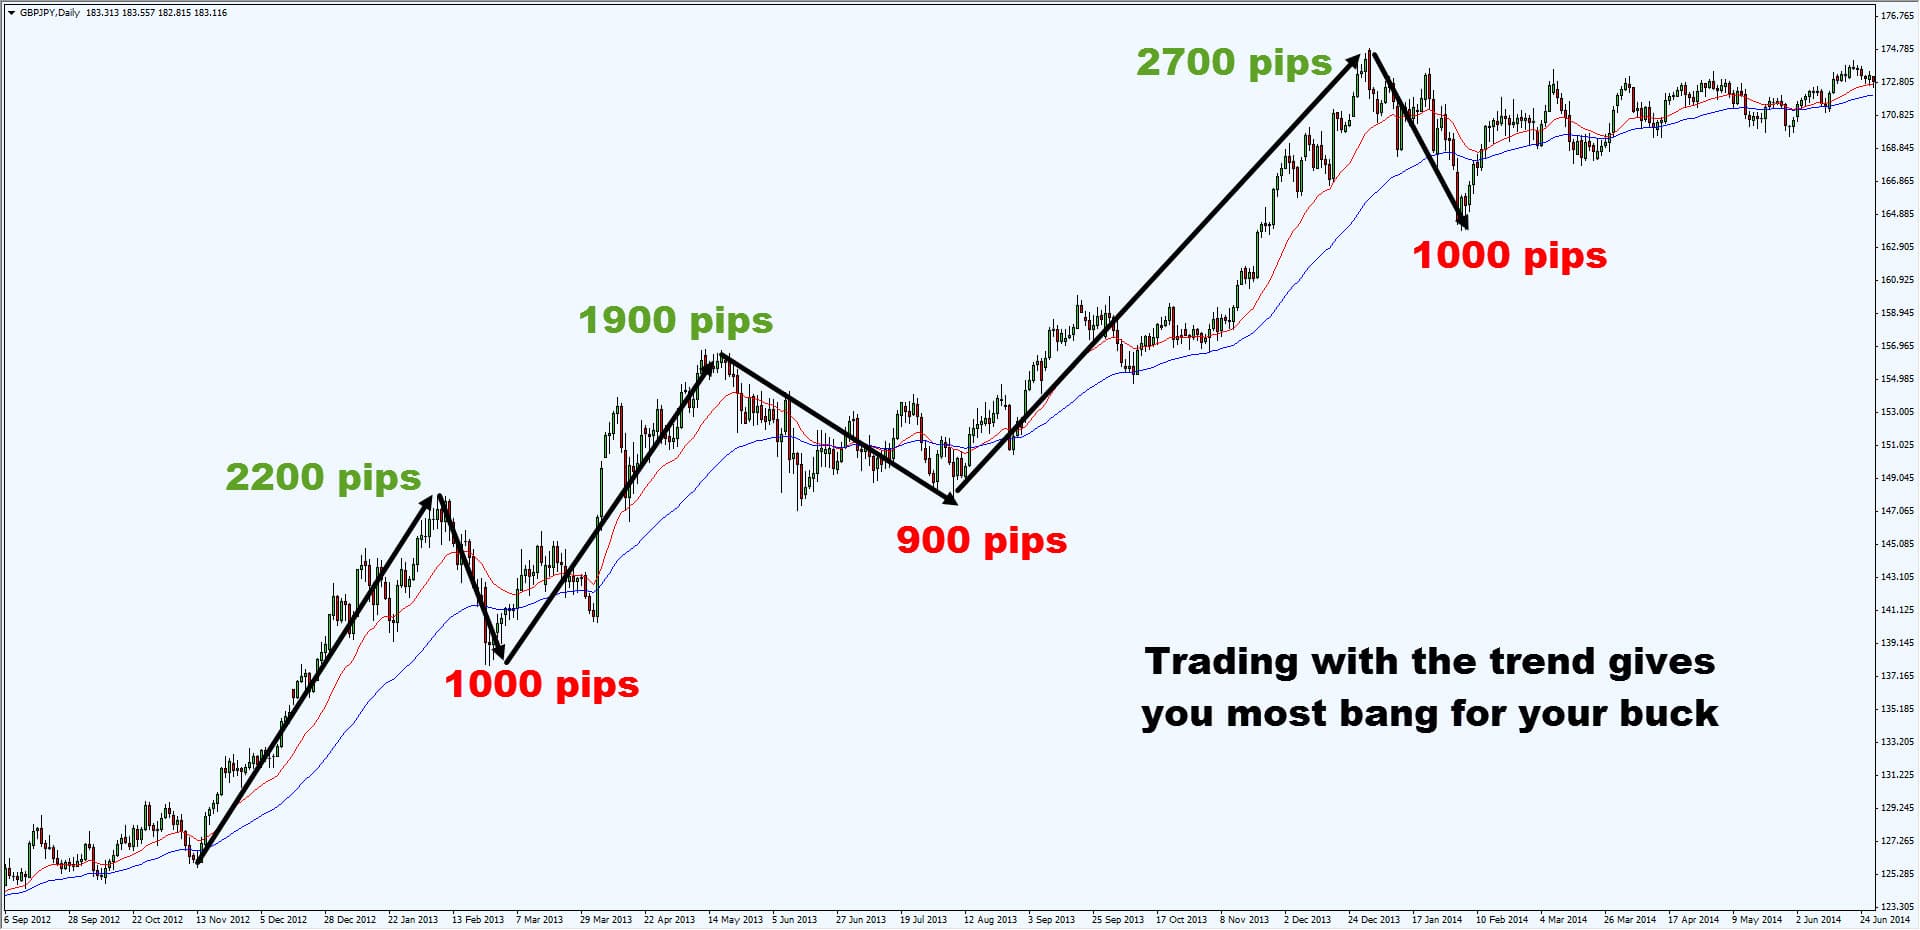
8. Trading with the trend gives you greater profit potential
A mistake made by many traders is that they become so involved in trying to catch the minor market swings that they miss the major price moves. – Jack Schwager
One of the best ways to improve your trading performance is, trading with the trend (and not against it).
This greatly increases the odds of your trade working out, and gives you a greater profit potential.
Here’s what I mean…
Now…
If you want to learn how to define a trend, go watch this training video below:
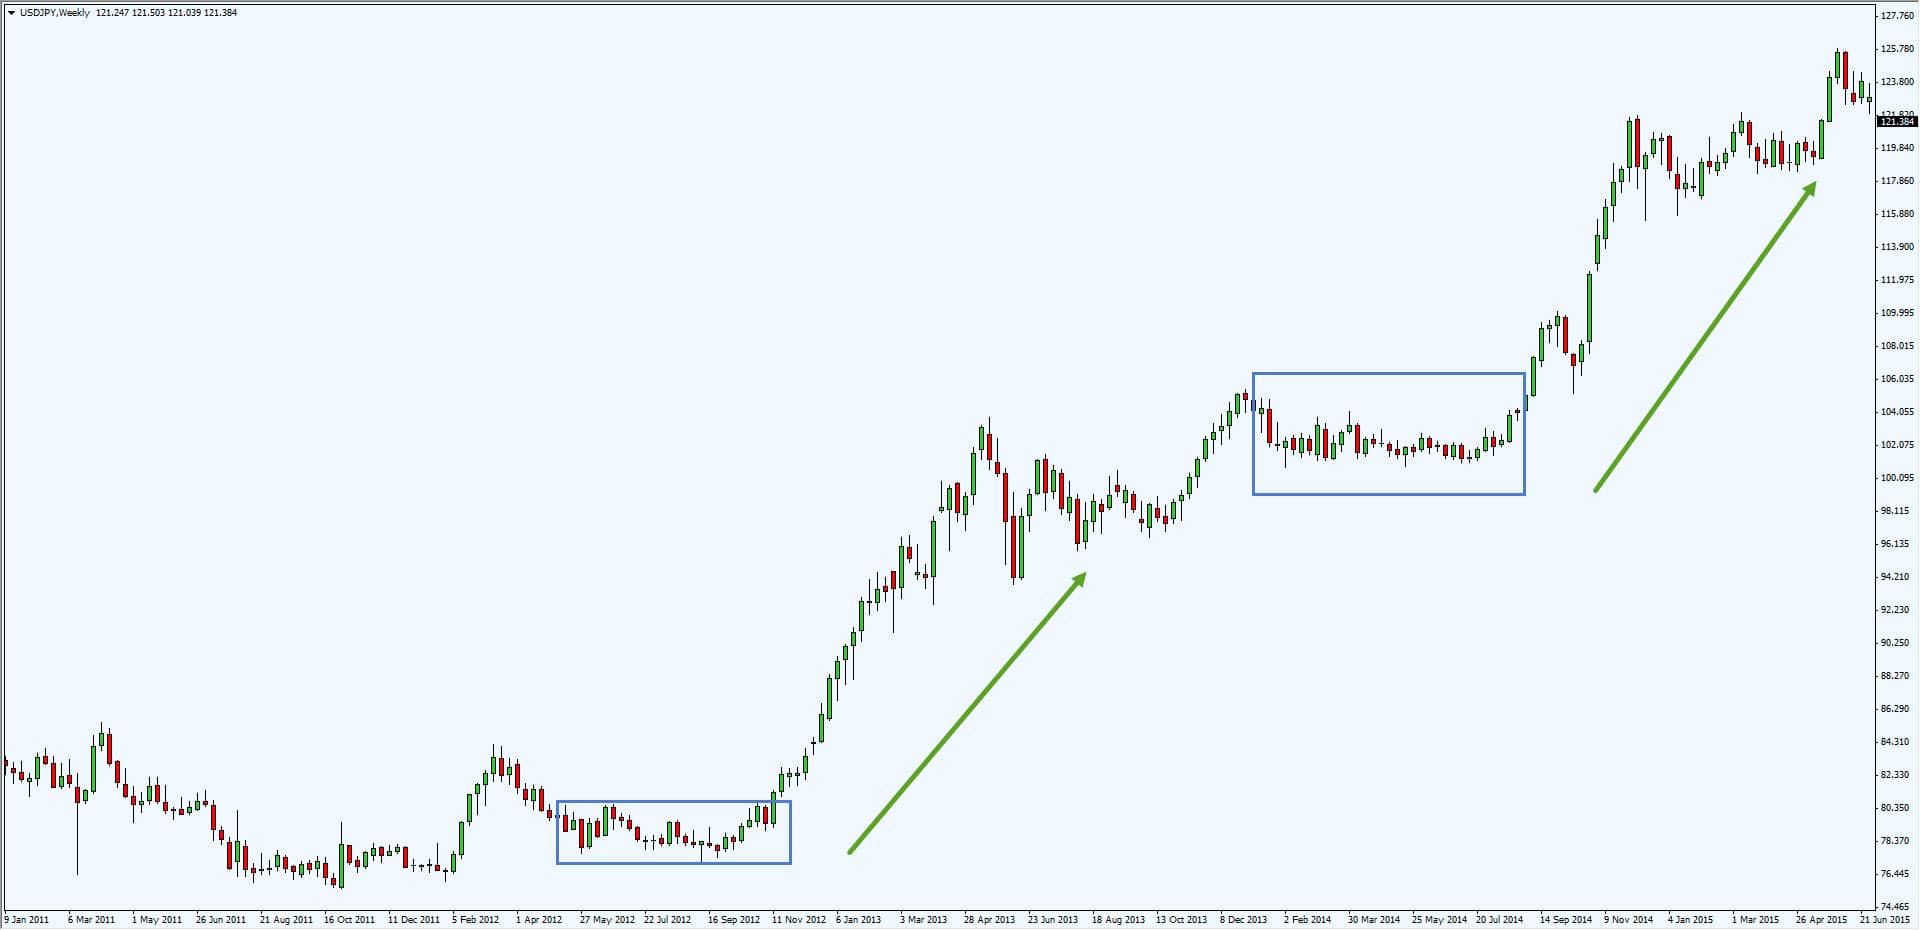
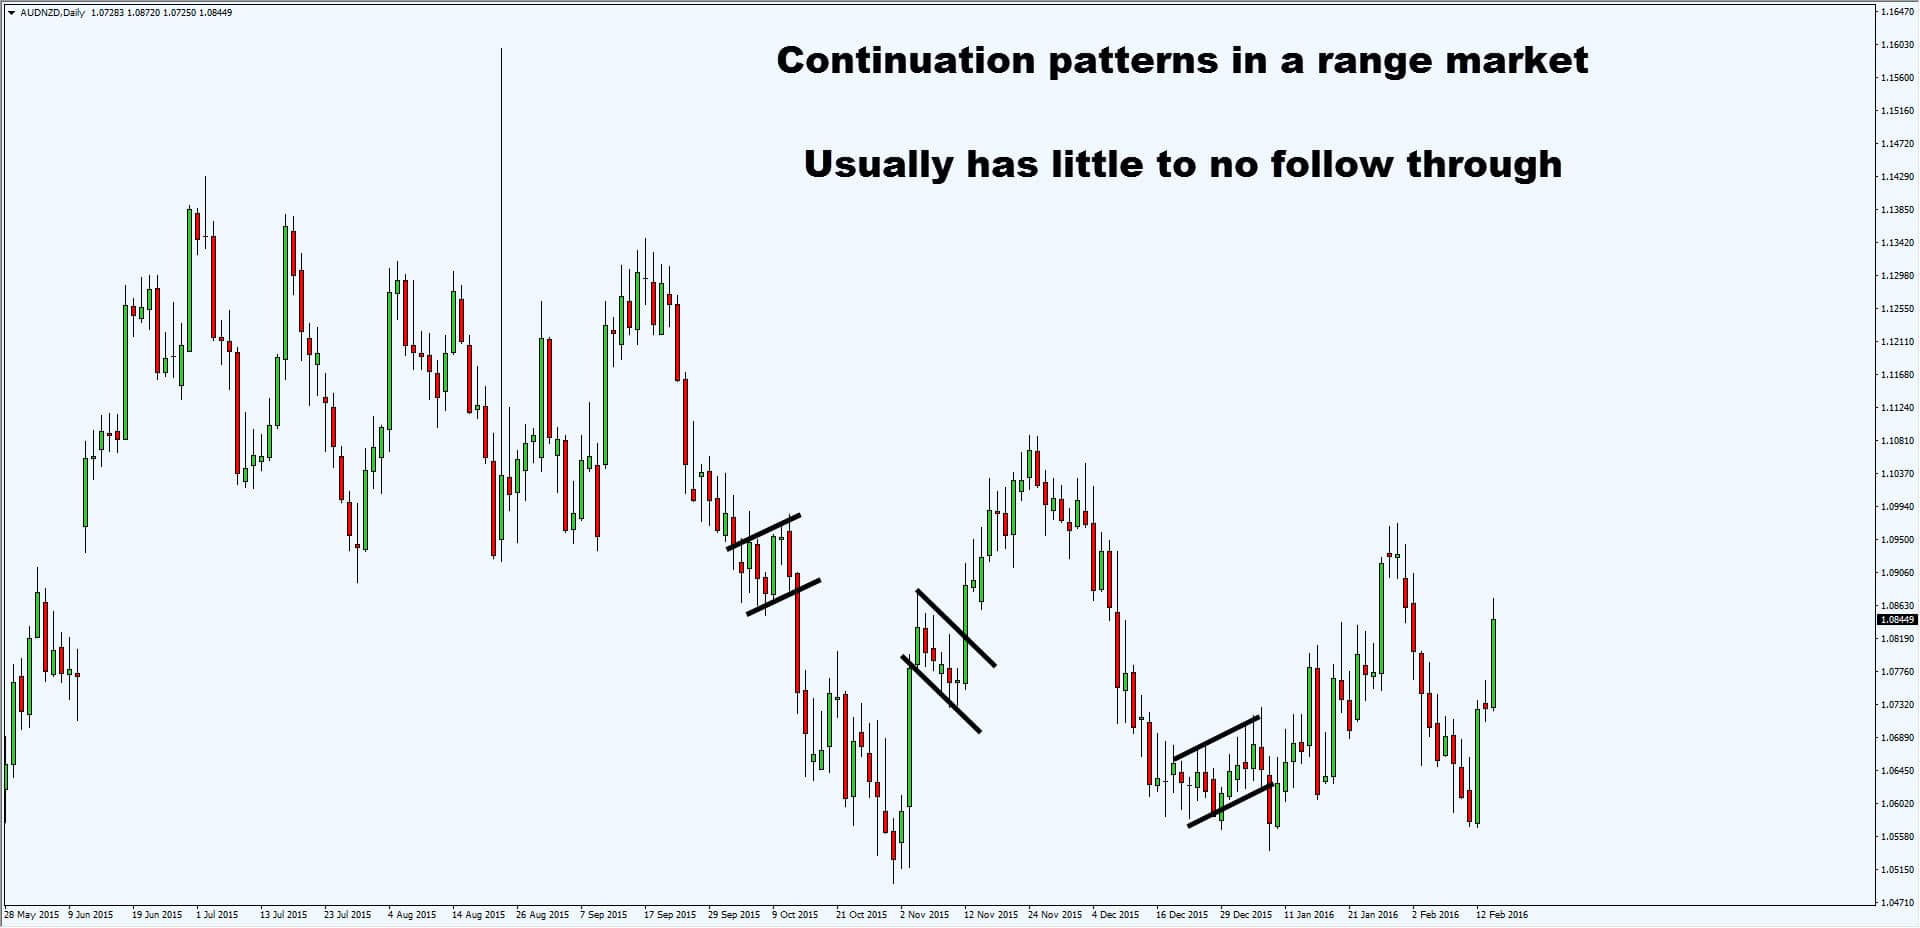
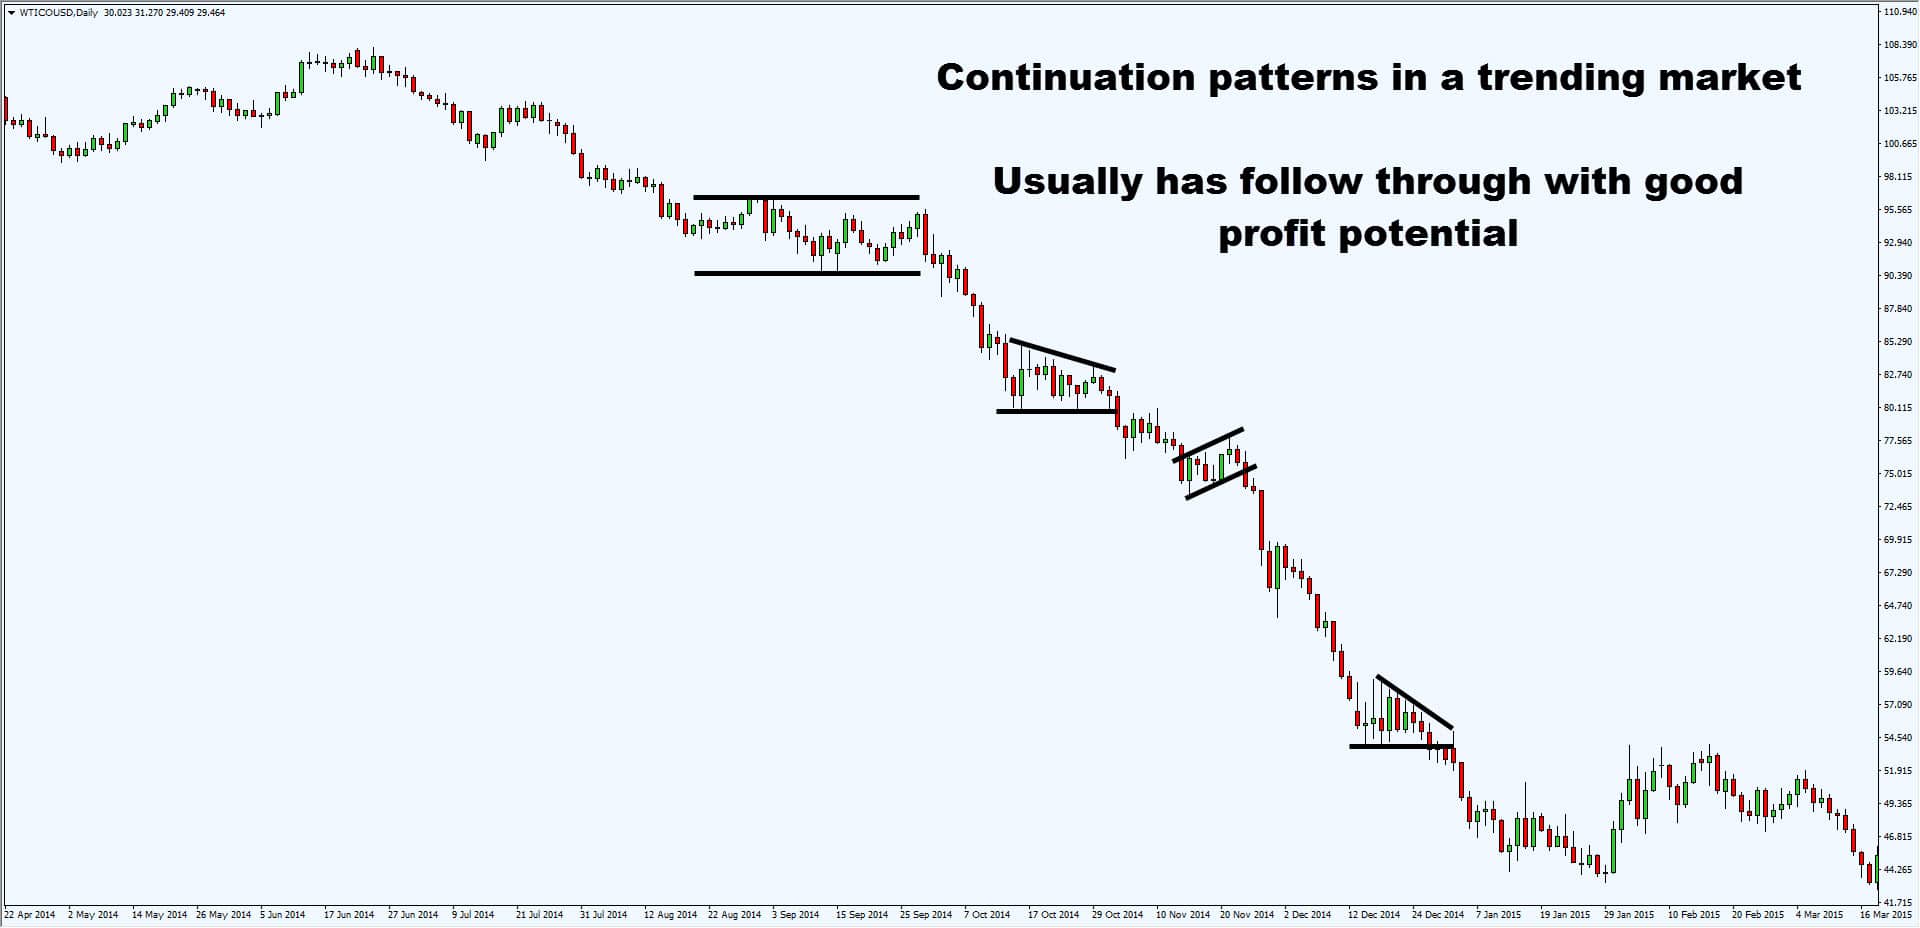
9. Continuation patterns work best in trending markets
You may wonder:
What are continuation patterns?
They’re chart patterns such as flags, pennants, triangles etc.
And…
A big mistake traders make is, to trade these patterns in a range market.
An example:
So, when is the best time to trade continuation patterns?
…
…
…
You guessed it, in a trending market.
An example:
Moving on…
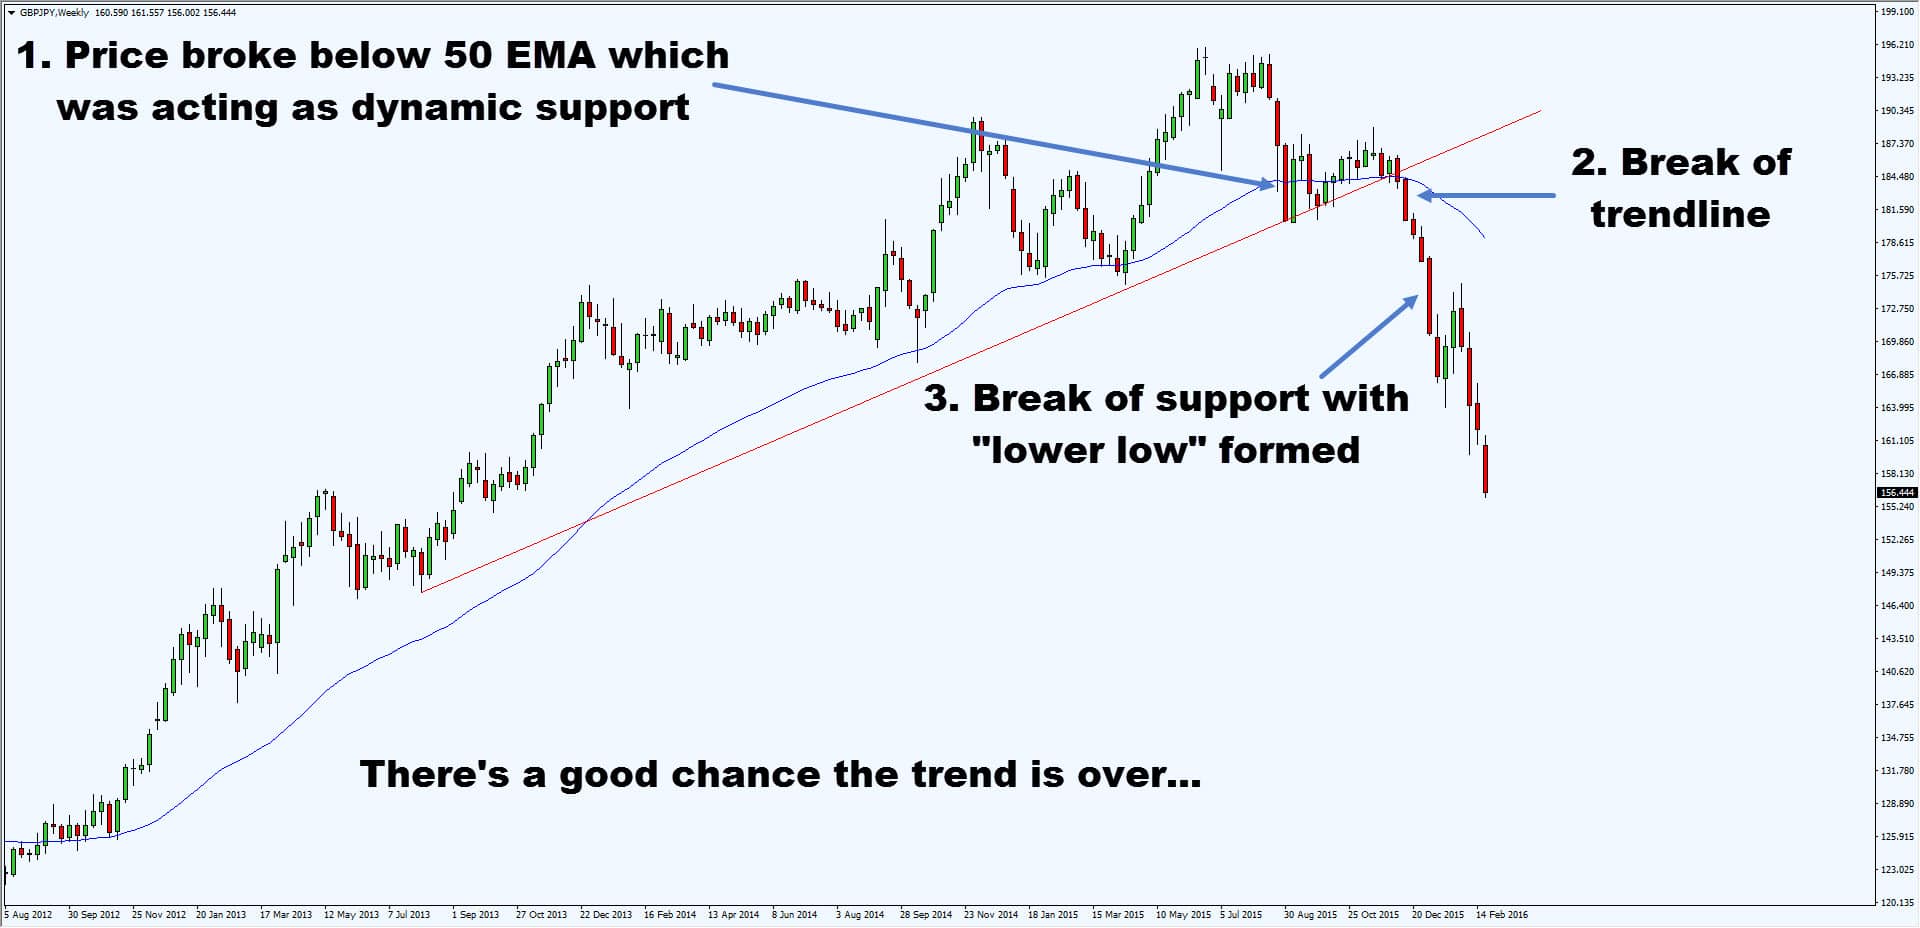
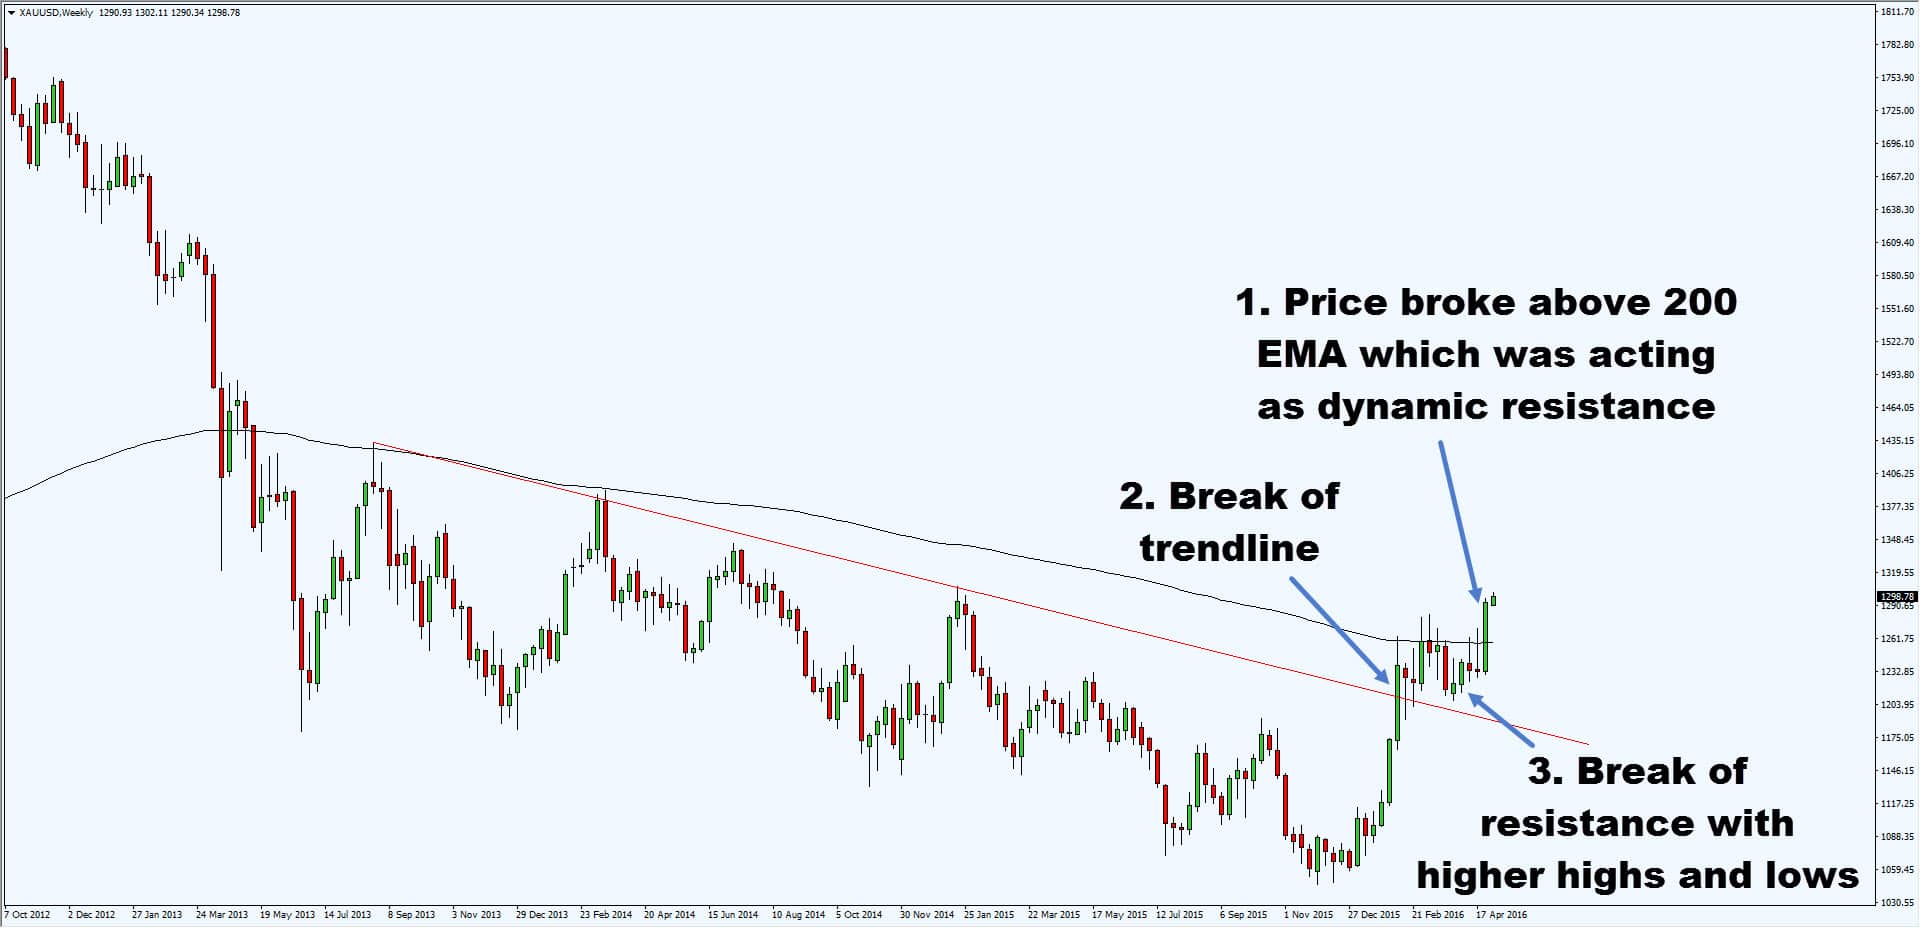
10. How to tell when a trend is ending
These are 3 things I’ll look out for:
A “respected” moving average is broken
Break of structure
Break of trendline
An example:
Let’s look it one by one…
Price broke and closed below the 50 EMA, which was a dynamic support that has been “respected” by the markets
Price broke and close below the trendline
A new structure low in the market is formed. Now you’ve got a lower high and lower low
When you’ve got all 3 factors lined up, it increases the odds that the trend is over.
Here’s another example:
To recap, these are 10 price action trading tips you’ve learned today…
Avoid trading when the market is far away from the moving average
Support & resistance helps you identify areas of value to trade from
Trading at support & resistance gives you favorable risk to reward
The longer it range the harder it trends
Narrow range candles usually lead to explosive moves
Wide range candles serve as “hidden” support & resistance
False breakout provides one of the best entry to profit from “trapped” traders
Trading with the trend gives you greater profit potential
Continuation patterns work best in trending markets
A break of structure, trend line, and moving average usually indicates the trend is coming to an end
If someone had shared these with me when I first started out, it would have reduced my learning curve, and saved me a ton of frustration.
Now, if you found this post useful, then you’ll also enjoy The Ultimate Guide to Price Action Trading (where you’ll learn additional trading tips & tricks you’ll not see elsewhere). Go download it and let me know what you think.
In the meantime, I wish you good luck and good trading. I’ll talk to you soon.
One trade is meaningless outside a trading system. A trading system can not be implemented without a trading plan. Entries are just the beginning; the exit is what determines if a trade is profitable or not.
Here is the structure all traders need for long term success:
We have to create a trading system that back tests show would have been profitable.
We then create a trading plan that shows how to execute our trading system with real money.
You need quantified entry signals to tell you when the risk/reward is in your favor.
Position sizing has to be determined based on volatility.
The risk of ruin has to be eliminated or you will eventually blow up your trading capital.
A trader needs to trade primarily in the direction of the trend in their time frame.
We must have a price level that will tell us when were wrong about a trade and need to exit with a small loss.
We need exit signals to tell us when to exit and lock in profits when we are right.
We must have trading rules that override our fear, greed, and ego.
We must have the discipline to follow our trading rules no matter how we feel.
Most traders are not undone by their method or system, but rather they are undermined by an internal struggle. Problems arise when the adrenaline starts pumping and emotions come into play; this is the time when bad decisions are made. Pride, Fear, Greed, and Hope are the most dangerous internal indicators to overcome.
Pride screams, “Don’t stop your loss! Prove you are right! It will come back, just wait.”
Fear advises, “Go ahead and take your profit quickly! We can’t let our winners run. Let’s take the small profit now, because the profit could reverse and we will end up with a loss.”
Greed assures, “This trade can’t miss! I am sure it will be a huge winner. Bet your whole account! We will be rich!”
Hopewhispers, “I am not sure what a good entry is here, so I am just going to buy this stock and hope for the best.”
Below are some great videos about these emotions by Scott O’Neil. He is President of MarketSmith Incorporated, a stock research tool developed by a team of investment professionals at William O’Neil + Company, a Registered Investment Advisor for Institutional Money Managers. They provide equity market buy/sell recommendations and independent research. Scott is also a portfolio manager with O’Neil Data Systems, Inc. -Forbes
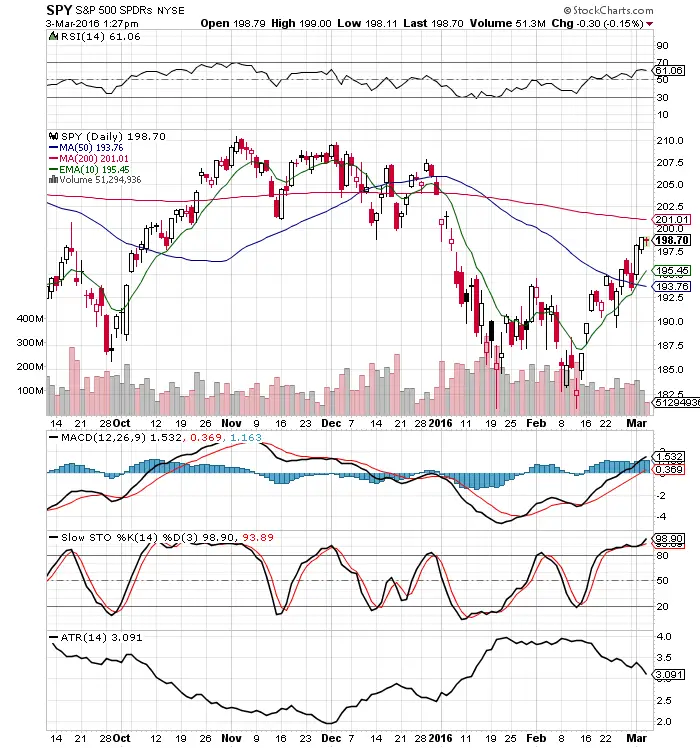
Signals help traders filter out their opinions and focus on price action. These tools help capture trends in your own time frame.
The 200 day SMA measures the long term trend. Price above long term bullish, prices below signal long term bearish.
The 10 day EMA measures the short term trend. Price above short term bullish, prices below signal short term bearish.
The MACD crossover can signal an intermediate swing trade.
The Slow Stochastics crossovers can signal short term reversals in the trend.
A declining ATR shows volatility decreasing and an ascending ATR shows volatility increasing. This is a signal to help calibrate position sizing.
The RSI shows the risk/reward ratio increasing and decreasing. The 30 RSI favors the bulls risk/reward for entry and the 70 RSI favors the short sellers risk/reward ratio.
The magic of these trading indicators comes when you combine them to create your own trading methodology that fits your own risk tolerance levels and then trade your system with the right risk management and discipline.