Showing posts with label Bull Market. Show all posts

Wednesday, October 19, 2016

Find a Monster Stock in 15 steps

Monster stocks are those wonderful beasts that make you look like a genius trader.
Shorts think that they are way too expensive and will crash, so they go short and have to cover en-mass after another 10 point run; they create even more buying pressure. Traders that short monster stocks do not understand the momentum that earnings expectations and growth cause for a stock’s price. They do not understand supply and demand. A stock that is $300, $400, or $500 based on earnings per share, could still be fundamentally cheaper than a $10 junk stock that has billions of shares floating around with tiny earnings per share.
Sounds great, but where do we find these beasts?
Many times, they are right under our noses. What about your new favorite energy drink, your favorite store at the mall, a new drug you are using with amazing results, your favorite restaurant, or the fact that you love everything Apple? Choosing a company you love is just the start of the process. Next you have to find out if it is a growth story, or if it is in decline. A stock’s price can only increase in conjunction with earnings growth or future earnings expectations.An old, giant, low growth big cap stock can only grow through innovation and not size.
“Buy the best, forget the rest.”

How to Find a Monster Stock
  1. Review the IBD 50 each week for the best stocks in the market. The list is in the Monday edition of Investor’s Business Daily and available by subscription to www.Investors.com.
  2. Look for higher priced stocks, with a minimum above $20. The best are often times the most expensive before splitting: $200, $300, $500 and up.
  3. Earnings should be greater than 25% for the past few quarters, and growing steadily.
  4. Sales should be close to equal with earnings and growing at +25%.
  5. The best stocks should have a return on equity between 25% and 50%.
  6. Look for growing industries where profits are expanding.
  7. Monster stocks are the #1 company in its industry. Buy the best, forget the rest.
  8. The stock should trade at least 500,000 shares a day, preferably a million.
  9. Monster stocks are currently loved by mutual funds, and there are holders and buyers.
  10. Monster stocks are special. They have a new product, service, innovation, or business model that is hard to copy or compete with.
  11. Monster stocks have their best price action in bull markets with their key moving averages price supports at the 5 day ema or 10 day sma.
  12. Even in bear markets or corrections, monster stocks bounce at the 50 day or 200 day sma creating a high probability entry point.
  13. The majority of monster stocks have high volume options traded on them, creating liquidity that can be traded with little bid/ask spreads.
  14. The majority of monster stocks are household names or most people know about their product.
  15. Find and trade the very best monster stocks. You only need 5 to watch and trade.
Recommended reading: Monster stocks book by John Boik.
(Never risk more than 1% of your total trading capital on any one trade, always plan your position sizing carefully and have a planned stop loss along with a trailing stop to lock in profits.)

Wednesday, April 6, 2016

Make Money Trend Trading

The reason trend traders make money in the long term, is due to supply and demand, and the flow of capital through equities, currencies, commodities, and future contracts. These tend to trend in one direction or the other at different times. Trend traders and trend followers are ready to capitalize on those trends by letting the market determine their buy and sell decisions. They always seek to be on the right side of the market.
Here is why it works:
  1. Bear markets have no supports; they keep falling until a new support level is found.
  2. Bull markets have no resistance, and they keep going up until a new resistance level is found.
  3. The world’s capital is always looking to find returns; this flow causes trends to emerge.
  4. Monster stocks can double due to earnings growth expectations.
  5. Currencies can plunge based on fear of a nations solvency.
  6. Commodities can rise to absurd levels based on supply expectations.
  7. Fear can bring down markets, far below what anyone thinks is rational.
  8. Greed can inflate markets far above any reasonable valuations.
  9. Trend traders are not predicting price action, they are simply following it. They let reality guide them, not opinions.
  10. Markets tend to trend, and systems that are able to capture those trends and minimize losses in choppy environments, are robust in the long term.

7 Signals I Need to Turn Bullish

There are so many traders and investors that remain bullish even when the stock market is under distribution. Bull opinions during market corrections are expensive. Smart traders and investors follow the trend. They go with the flow of price action.
  1. All stock indexes need to begin to trade above the 10 day EMA consistently for multiple days.
  2. The 10 day EMA needs to hold as intra-day support.
  3. The market needs the shorter term moving averages to begin to cross back over the longer term moving averages. Like the 5 day EMA over the 10 day EMA and the 21 day EMA over the 50 day SMA etc.
  4. The up days need to be on higher volume than the down days.
  5. Index ETFs need a MACD bullish crossover that holds.
  6. A large bullish engulfing candlestick that closes over the previous days price range and the 5 day EMA.
  7. Finally Index ETFs needs to close over the 200 day as my first sign of bull power and the potential for a return to all-time highs.
Here are 7 things I need to see to become bullish again and stop shorting strength primarily and start trading more on the long side.
If all these signals are met, I will become bullish again. Until then, the bears have control and I will be trading primarily on the short side.

Why the Cup & Handle Chart Pattern Works

While my trading is more following capital flows based on trends that I measure with key moving averages there is one chart pattern that I find very useful and that has high probabilities of success.
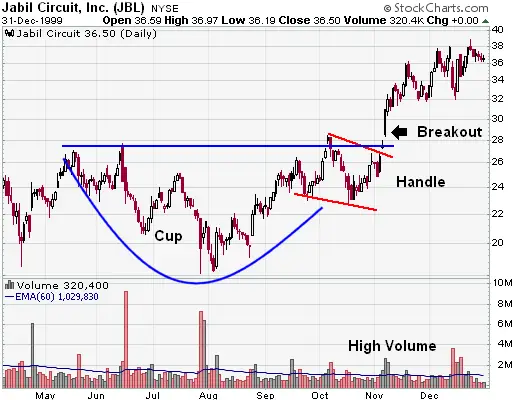
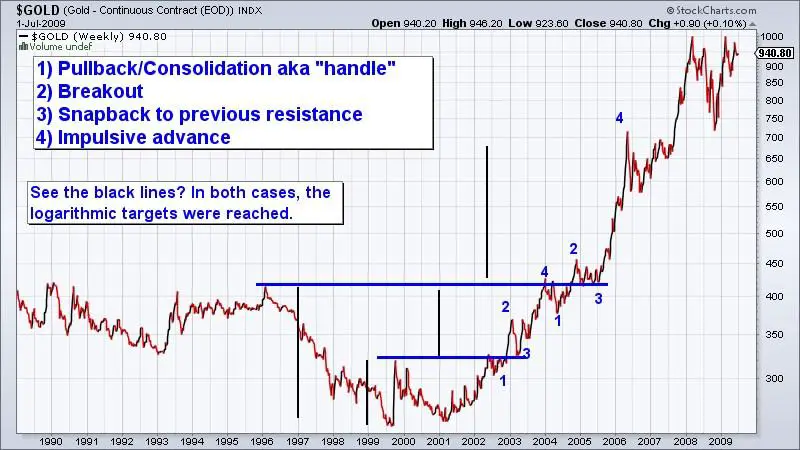
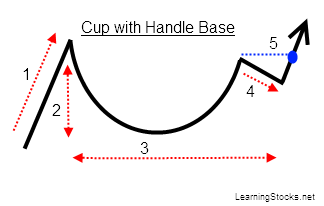
The cup and handle pattern is a bullish continuation formation, it is one of the newer chart formations and can be easily identified on a price chart. This chart pattern was first popularized by William J. O’Neil in the first edition of his 1988 book, How to Make Money in Stocks. In order for the cup and handle setup to have the highest odds of succeeding, it should come after a clear uptrend is in place. The chart pattern consists of two key components: (1) cup and (2) handle.
The cup part of the formation is created when profit taking sets in or the market itself is in a correction and the stock sells off and forms the left side of the cup. The cup bottom is formed when the stock finally runs out of sellers at new low prices and buyers start moving in and bidding the stock back up again as sellers demand higher prices to turn the stock over. Most of the time as the stock emerges out of the right side of the cup in an uptrend it fails and meets resistance the first time it tries to break out to new high prices and the pattern forms a handle. The second run at new highs usually works as the sellers have been worked through and the stock breaks out to new highs.
This pattern sets the stage for very nice up trends because the majority of short term traders sold as the stock fell into the cup, the bottom was formed when the holders of the stock refused to sell for less than the support level in the base of the cup, then profit takers were worked through as the stock came up through the right side of the cup. The investors and traders that sold at new highs the first time that price level was reached coming out of the cup were the last group of sellers to overcome as the stock breaks out of the pattern the second time it is a lack of sellers that propels the stock upwards as seats on the bull bus get more expensive because no one wants to give up their seat at that point in time.
Here’s a checklist for the  cup-with-handle pattern to see if it is truly puts the odds in your favor:
  1. Cup and handle patterns are not good probability trades if the general market is in correction or in a bear market.
  2. The pattern has better odds if it is a stock among a truly strong sector that has increasing earnings growth expectations.
  3. The stock should have had a previous uptrend leading into this pattern.
  4. Check the depth and length of the cup. A cup-with-handle base usually corrects 20% to 30% from the base’s left-side high, or 1-1/2 to two times the market average. Most are three to six months long, but can be as little as seven weeks or as long as a year or more. (IBD parameters)
  5. Look for a classic shape . If you have to argue your way into believing the shape is a cup, it’s not a cup.
  6. Note how much of the cup is in the lower half. A steady climb up the right side is best.
  7. Look for a U shape and volume that dries up near the cup’s low. Volume that dries up at the bottom suggests funds lost interest in selling. And U-shaped bases are more likely to work than V shapes.


Thursday, March 31, 2016

7 Ways to Trade With An Edge

“If you diversify, control your risk, and go with the trend, it just has to work.” -Larry Hite.
We often hear of trading with an edge, but how do we know for sure we have an edge? How do we know that the odds are in our favor, and that the more we trade, the more our accounts will grow? Are we really the casino and not the gambler, or are our short term winning the result of luck?
  1. One edge is in trading entry points in chart patterns that historically play out as a winning trade more times than a losing trade. Even taking entries that play out as winners only 60% to 70% of the time is much better odds than a random 50/50 entry point. The key is to do your homework and know the odds of each entry from specific chart patterns. Cups with Handles, candles sticks, and triangles are just some of these patterns. Thomas Bulkowski has done some amazing work around quantifying these patterns.
  2. Another edge is in the use of historical price action backtesting.Using software, historical price data, and technical indicators, a trader can see how a system would have done over an extended period of time across multiple markets. Moving averages and breakouts in different time-frames are used to measure the equity curve in a system.  This is the realm of the mechanical system trader. Price history gives the edge. Programming knowledge required.
  3. Another edge is to trade a method that has been proven historically as a winning one. The method should have rules on what to buy based on fundamental or technical criteria , when to buy, how much to risk per trade, when to exit at a loss or when to exit to lock in profits. One example of such a method is the CAN SLIM system by William O’Neil while the system is very robust it is more of an investing system than a trading system due to the time frames of the recommended buying and holding of stocks.
  4. Technical Analysis applied correctly can give a trader an edge. By trading what the chart is saying with support, resistance, trend lines and volume it will give a trader an edge over someone who enters randomly or based on opinions.
  5. Experienced discretionary traders can be their own edge through intuition which is developed through market experience and exposure to market behavior and what makes and loses money over many years of trading. Successful discretionary traders are like seasoned athletes who began to just know what to do in different circumstances based on past experience and learning through repetitive action. They are also like professional poker players that can instantly size up the odds of their hand and the possible actions of their competitors.
  6. An Emotional Edge can be gained by traders who make buy and sell signals based on systems and methods instead of fear and greed, they can step in and buy in a bear market when a reversal begins with a new trend upwards with out being clouded by fear and they can allow winners to run in a bull market not selling to soon out of fear of giving back profits. Traders not affected by their ego can sell quickly when they are wrong to avoid taking a bigger loss than is necessary. Much of trading is a mind game and do not underestimate the edge of having the discipline to follow your trading plan instead of your own fear and greed over taking you during market hours.
  7. Asymmetric Risk Edge is really THE edge that produces profits in the long term. The only way to make money in the long term is to have all your winners be bigger than all your losers. This can only happen by cutting losers short and letting winners run or having a very big win percentage. A good ground rule is to only take trades that can profit $3 for every $1 at risk. Only risk $1,000 if you believe you can make $3,000 on a specific trade. Of course a day trader with a 60% win rate may be able to get by with a $2 profit for a $1 risk if they stay disciplined in cutting losses and a trend following may have amazing returns with only a 30% win rate if there wins are 5 to 10 times their risk.