Rather, it’s reading the sentiment of the markets, identifying areas of value, and trading along the path of least resistance.
And yes, price action trading can be complemented with indicators. It’s about understanding your trading tools and knowing how to apply it effectively.
So, in today’s lesson…
You’ll learn 10 price action trading tips that will improve your trading performance immediately.
Ready?
Then let’s begin.
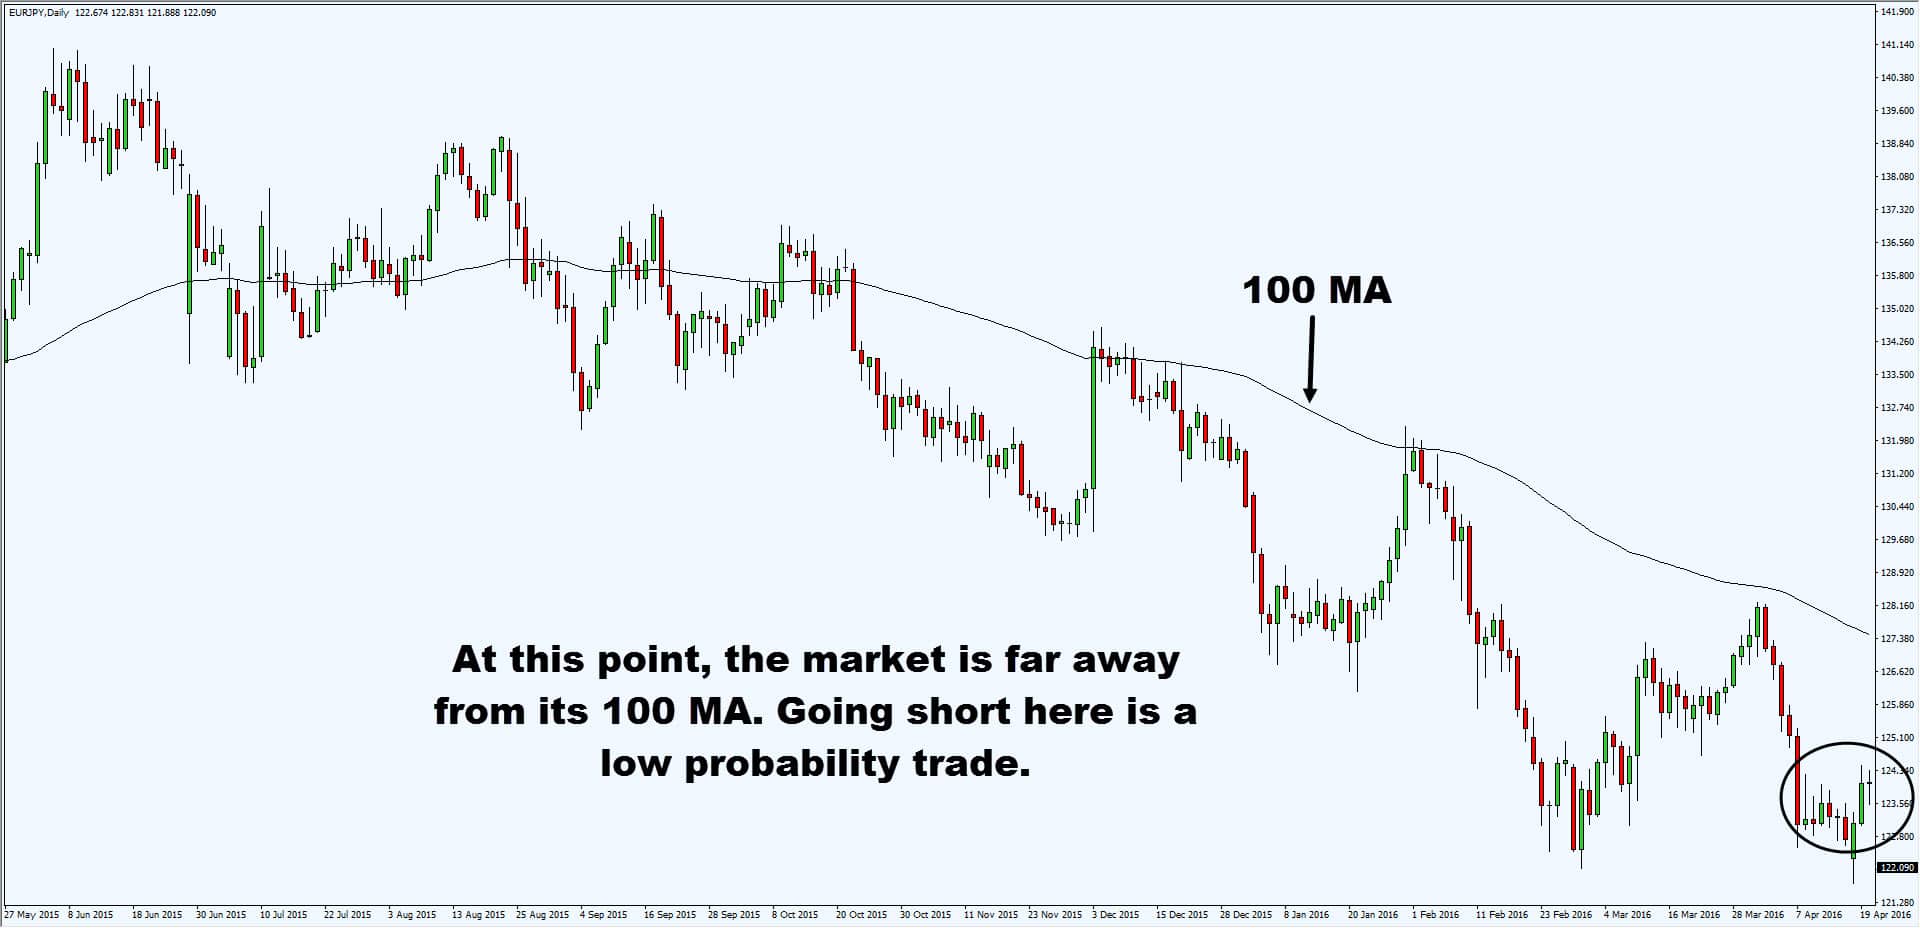
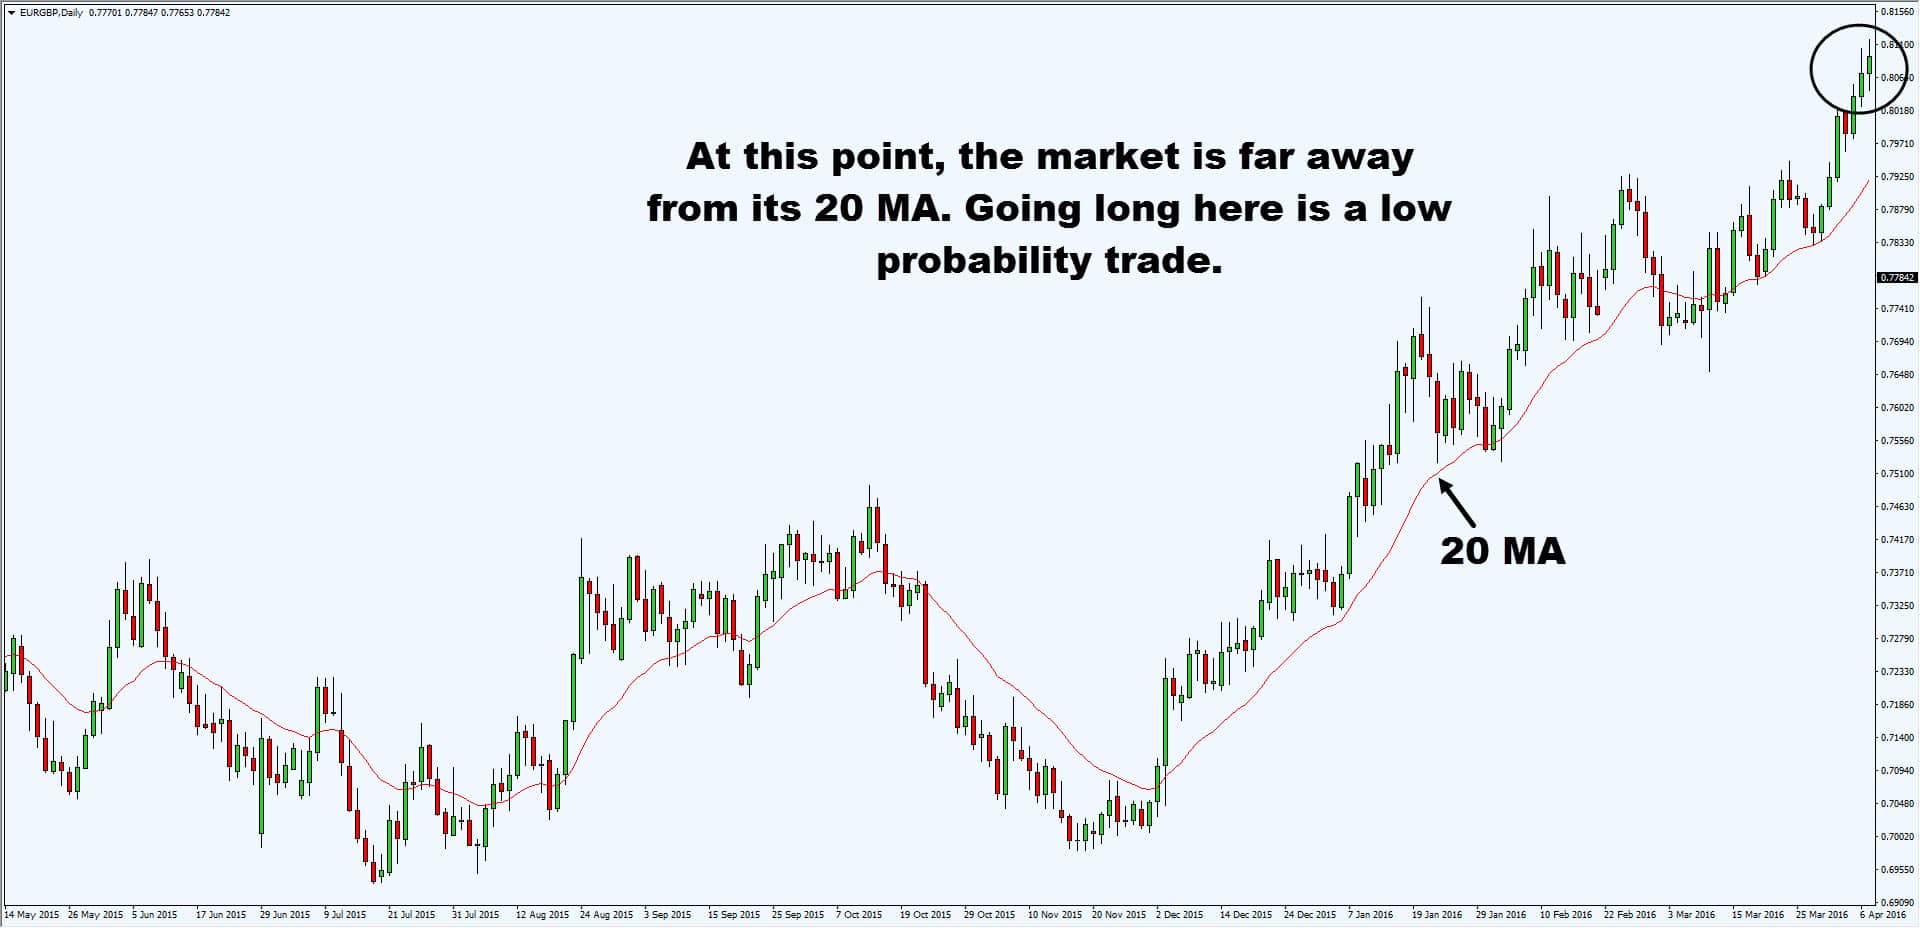
1. Avoid trading when the market is far away from the moving average
When the market is trending, it tends to mean revert towards the moving average.
Depending on the type of trend you’re in:
In a strong trend, the market tends mean revert to the 20 MA.
In a normal trend, the market tends to mean revert to the 100 MA
In a weak trend, the market tends to mean revert to 200 MA
Thus, the last thing you want to do is enter a trade when the market is far away from it’s moving average.
Here’s what I mean:
Pro tip:
You need to identify the moving average that is currently being “respected” by the markets.
In a strong trending market, the moving average value is lower, and in weak trending markets, the moving average value is higher.
2. Support & resistance helps you identify areas of value to trade from
You want to buy low and sell high, right?
But the question is:
How do you define what’s low and what’s high?
Allow me to introduce to you…
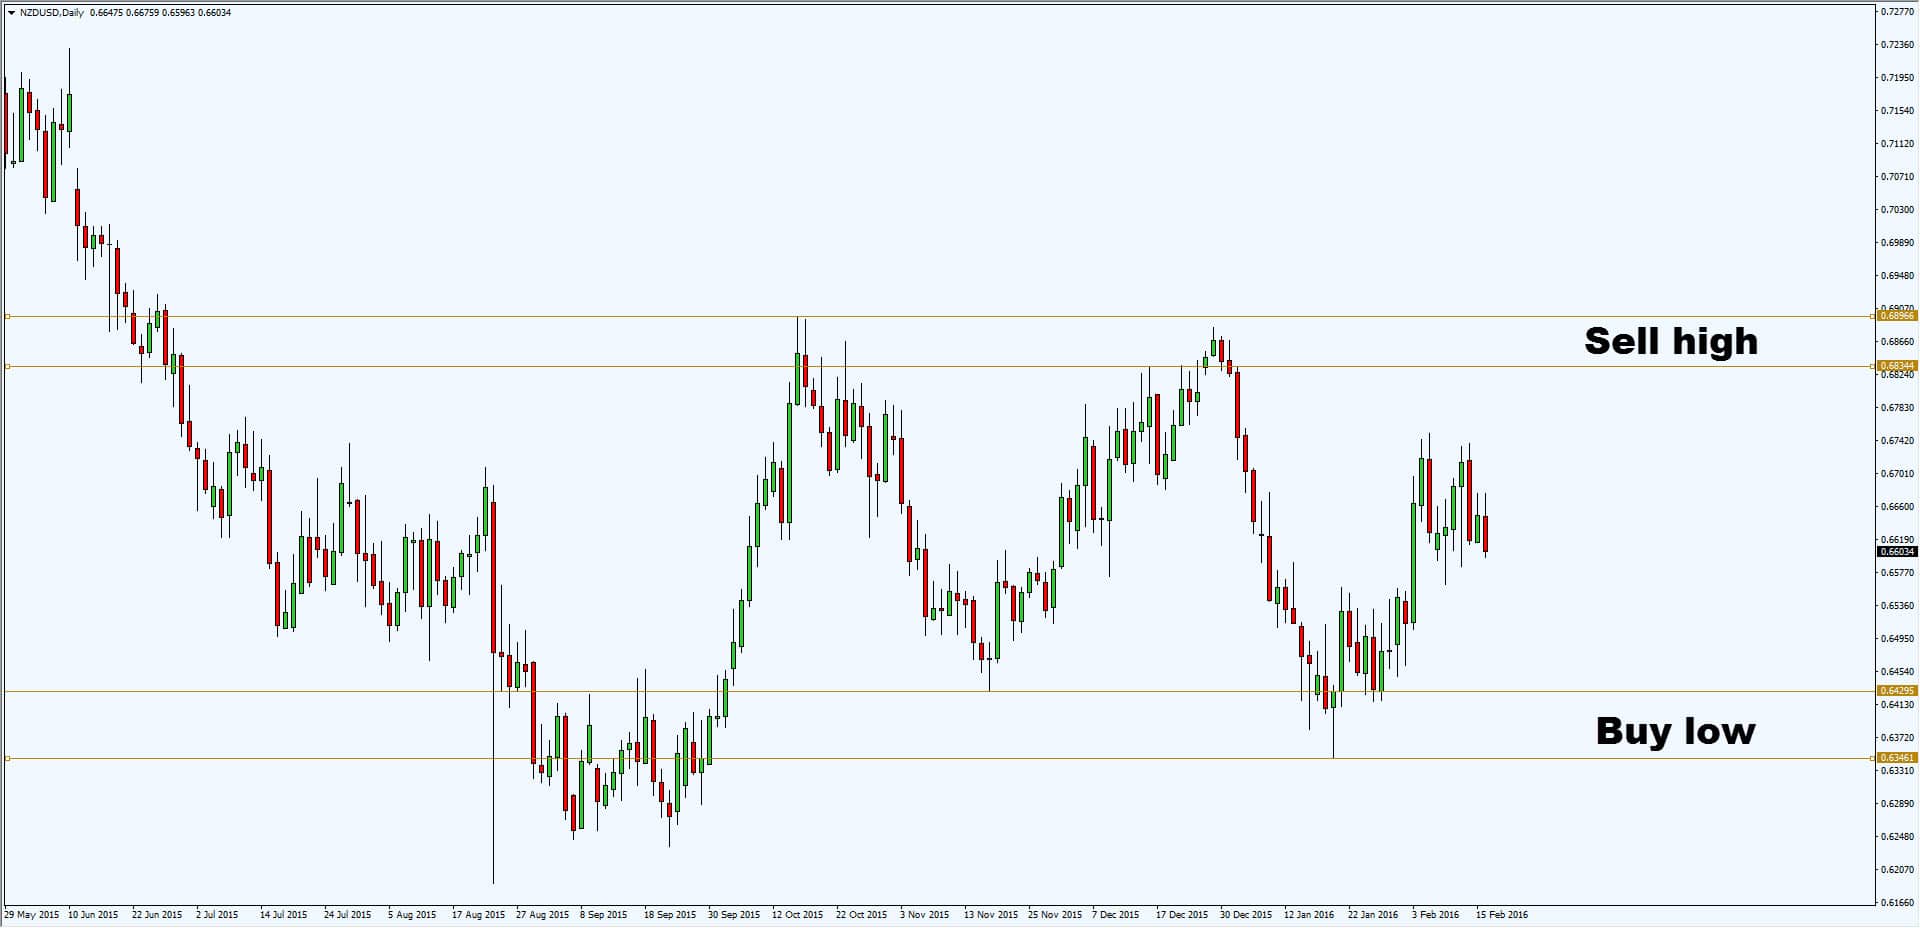
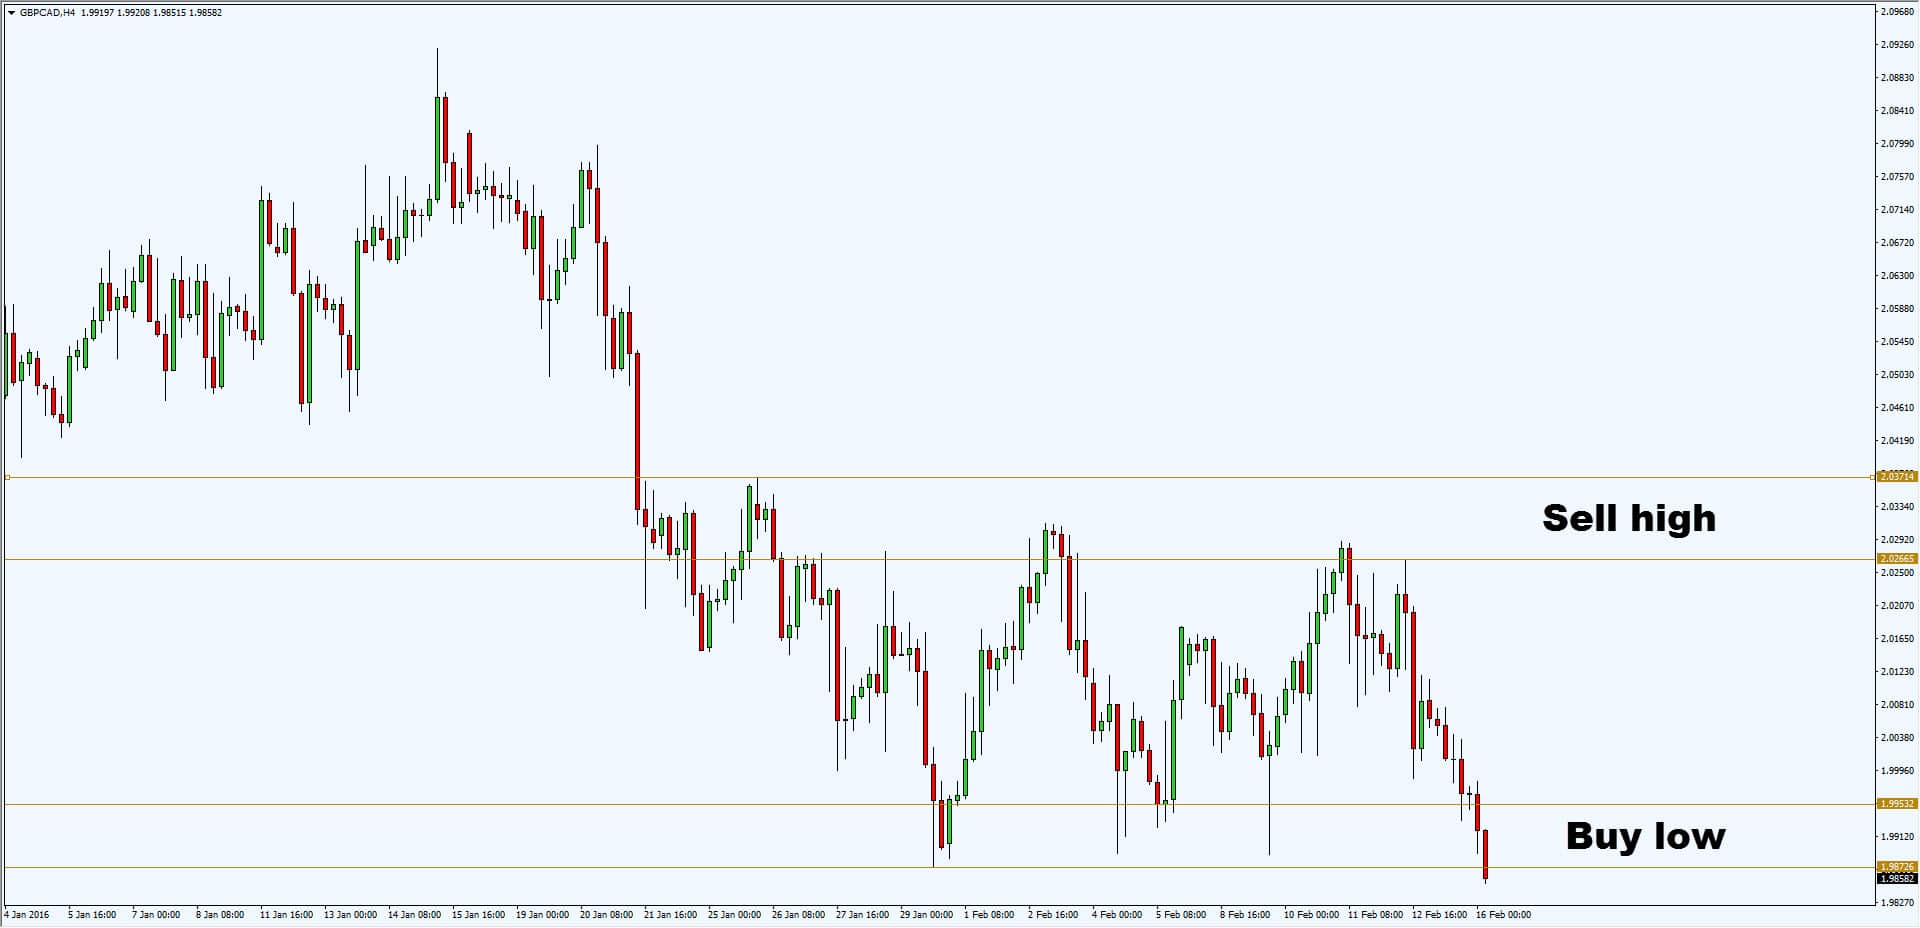
Horizontal support & resistance
This is useful because it helps you identify areas of value on the chart.
Support – Area on the chart where you’re are looking to buy “low”
Resistance – Area on the chart where you’re looking to sell “high”
Here are a few examples:
Also, moving average helps you identify areas of value in the form of…
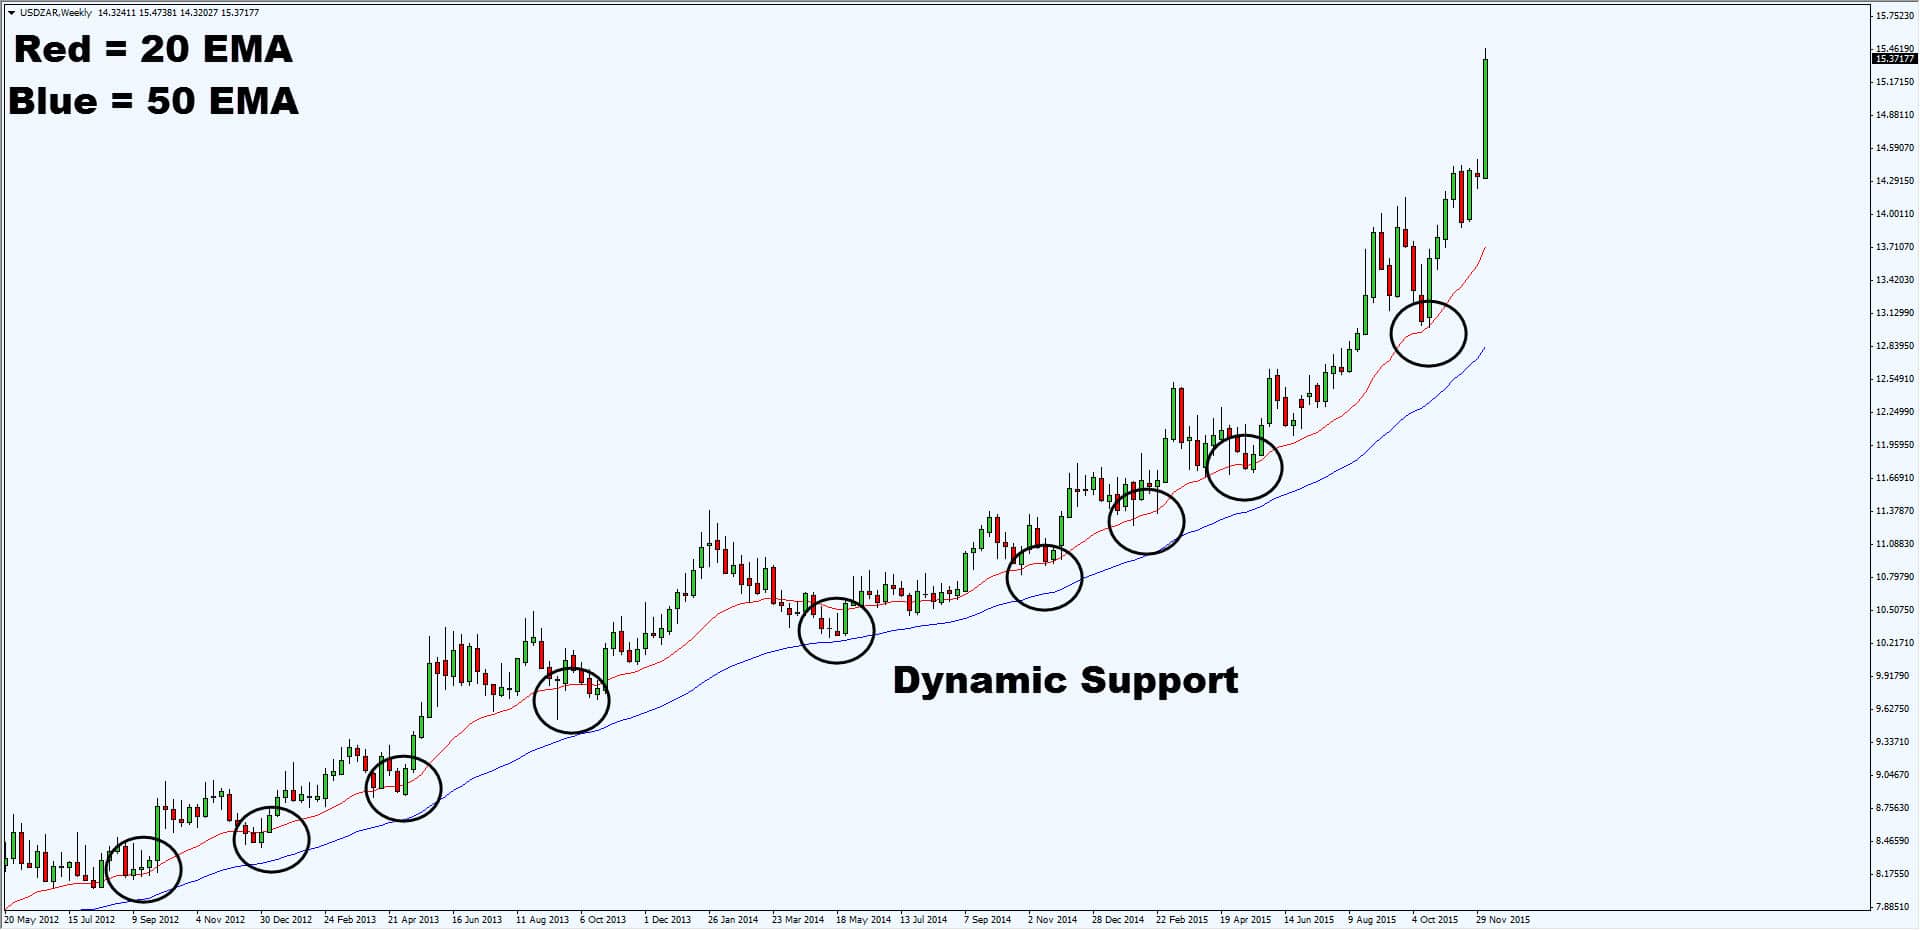
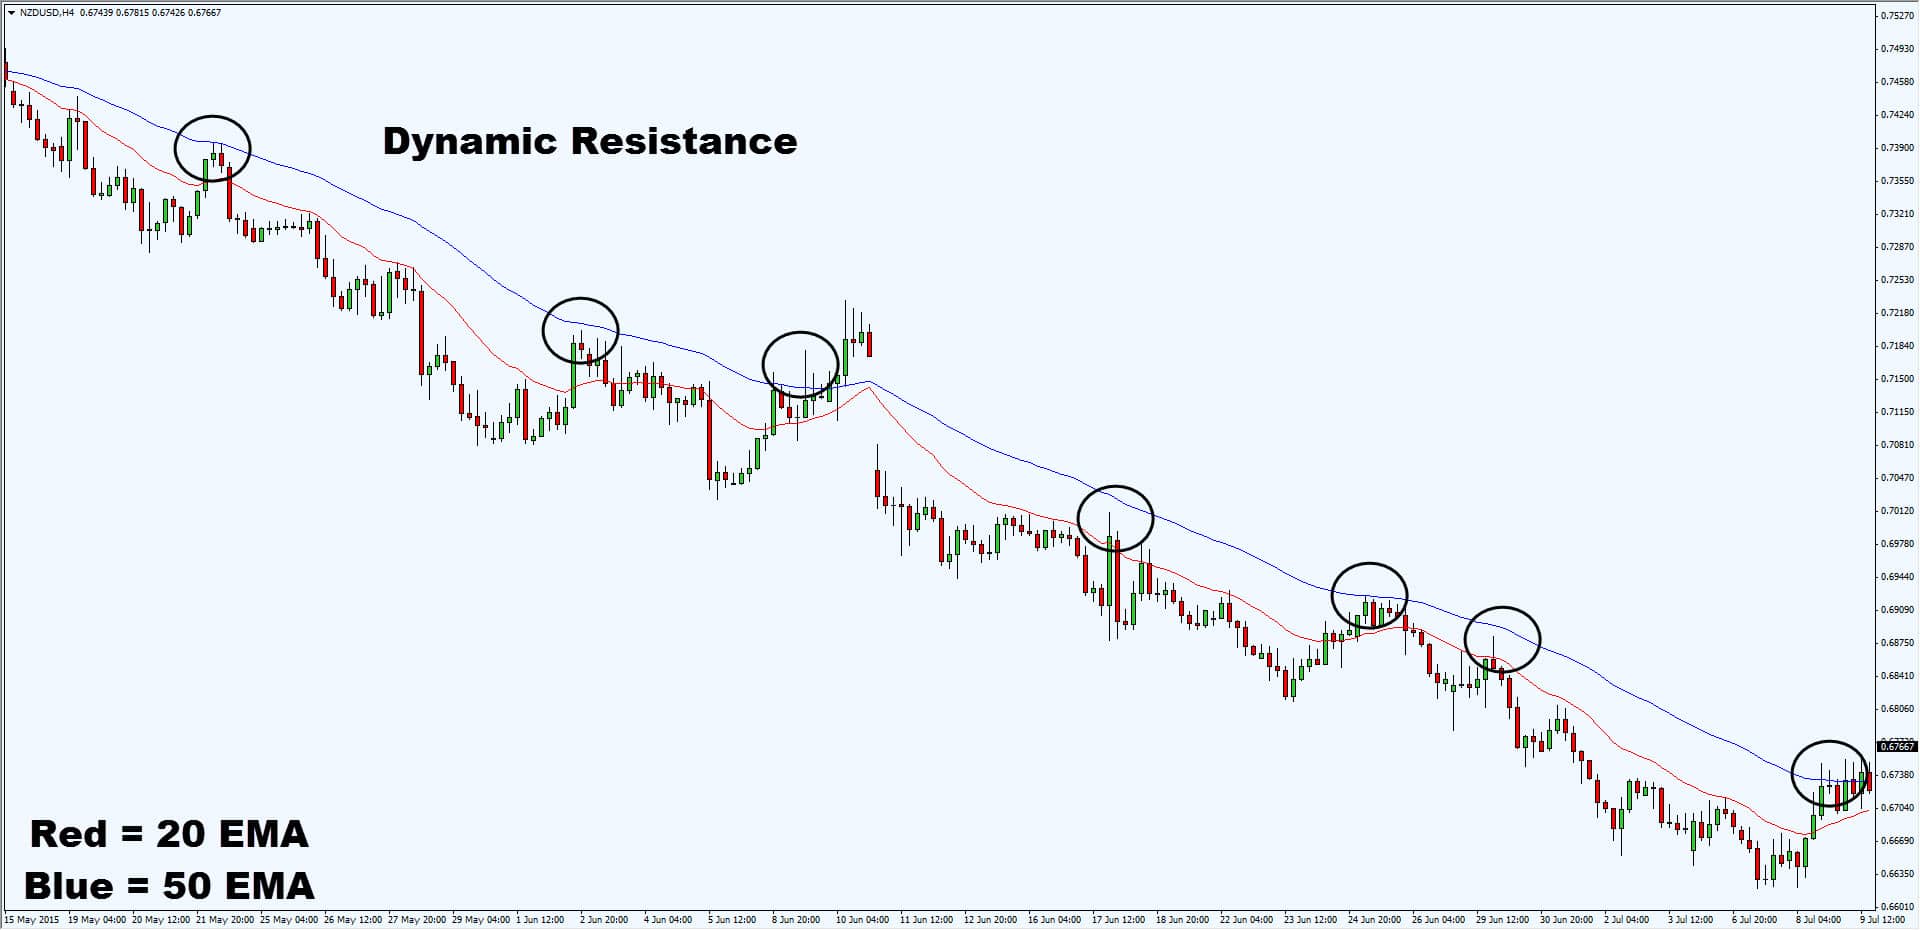
Dynamic support & resistance
These are Support & Resistance that moves along with the price.
Dynamic support occurs in an uptrend, and dynamic resistance in a downtrend.
They can be identified using moving averages. (I use 20 & 50 EMA).
This is what I mean…
Pro tip:
In a strong trending market, the price may not pullback towards horizontal support & resistance (which cause a lot of traders to miss the trend).
Instead, they tend to pullback towards dynamic support & resistance, which is an area of value you must pay attention to.
3. Trading at support & resistance gives you favorable risk to reward
Here’s the thing…
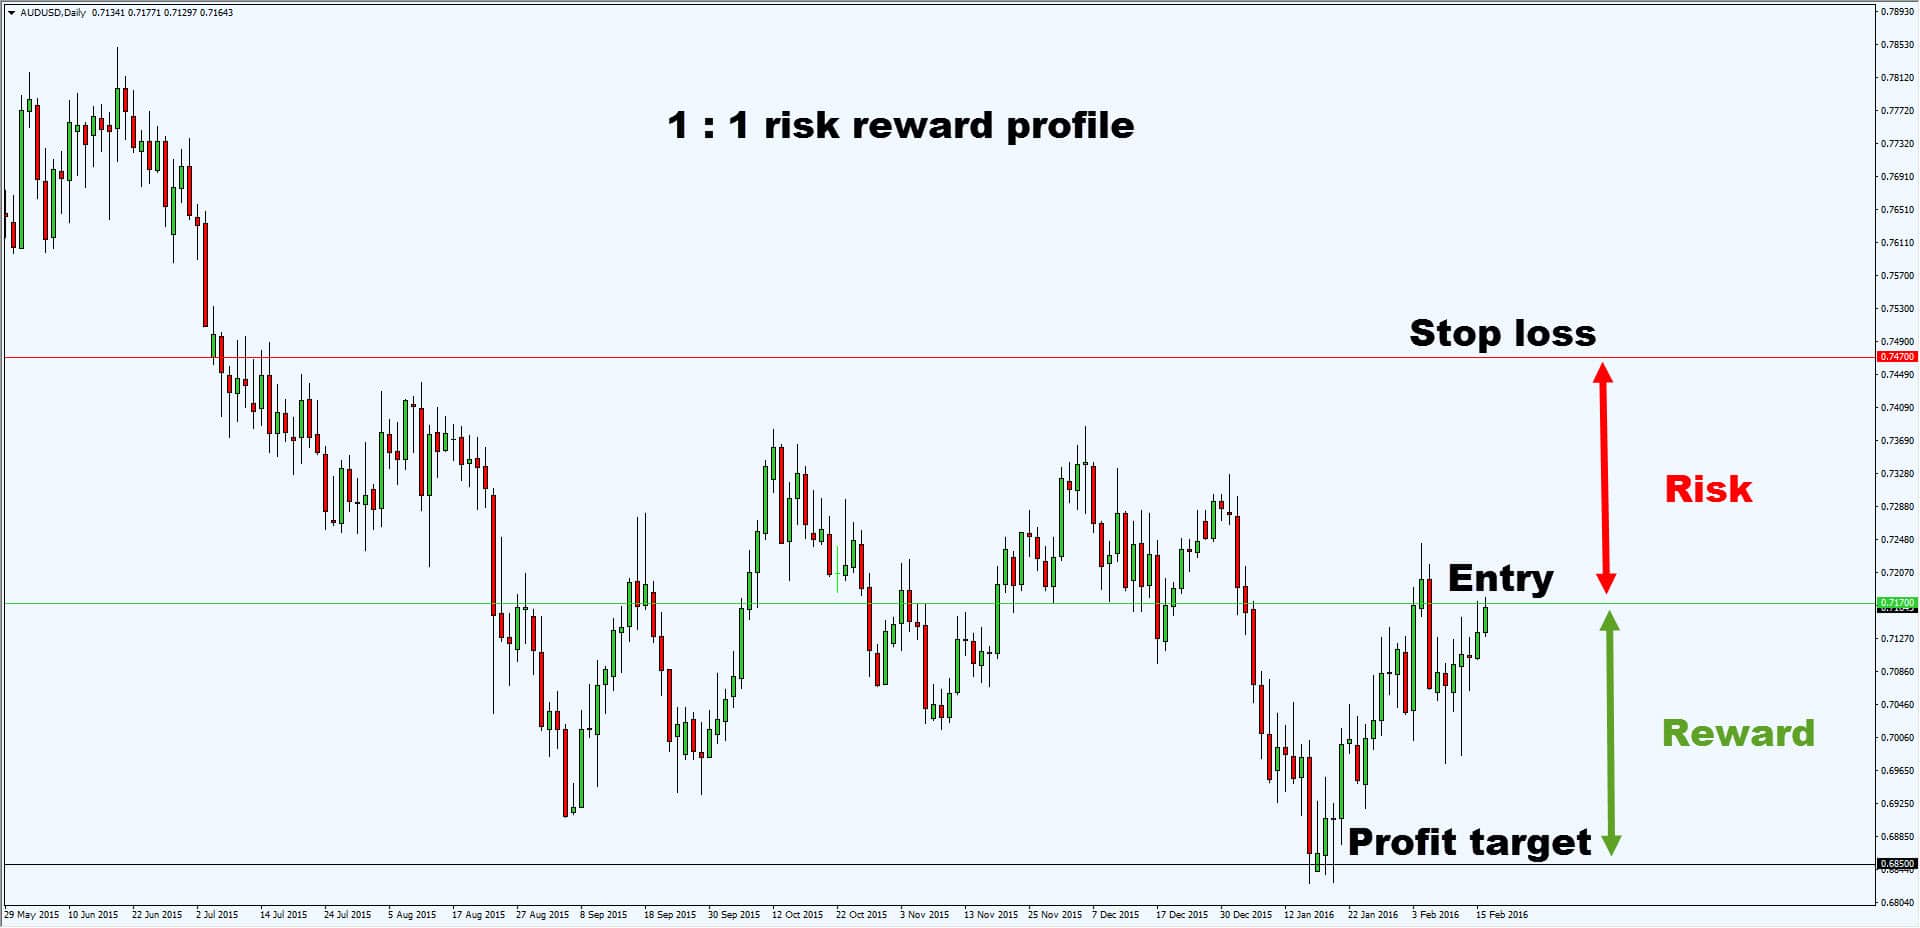
If you enter trades in the middle of a range, it never gives you a favorable risk to reward (at best 1 to 1).
An example:
But…
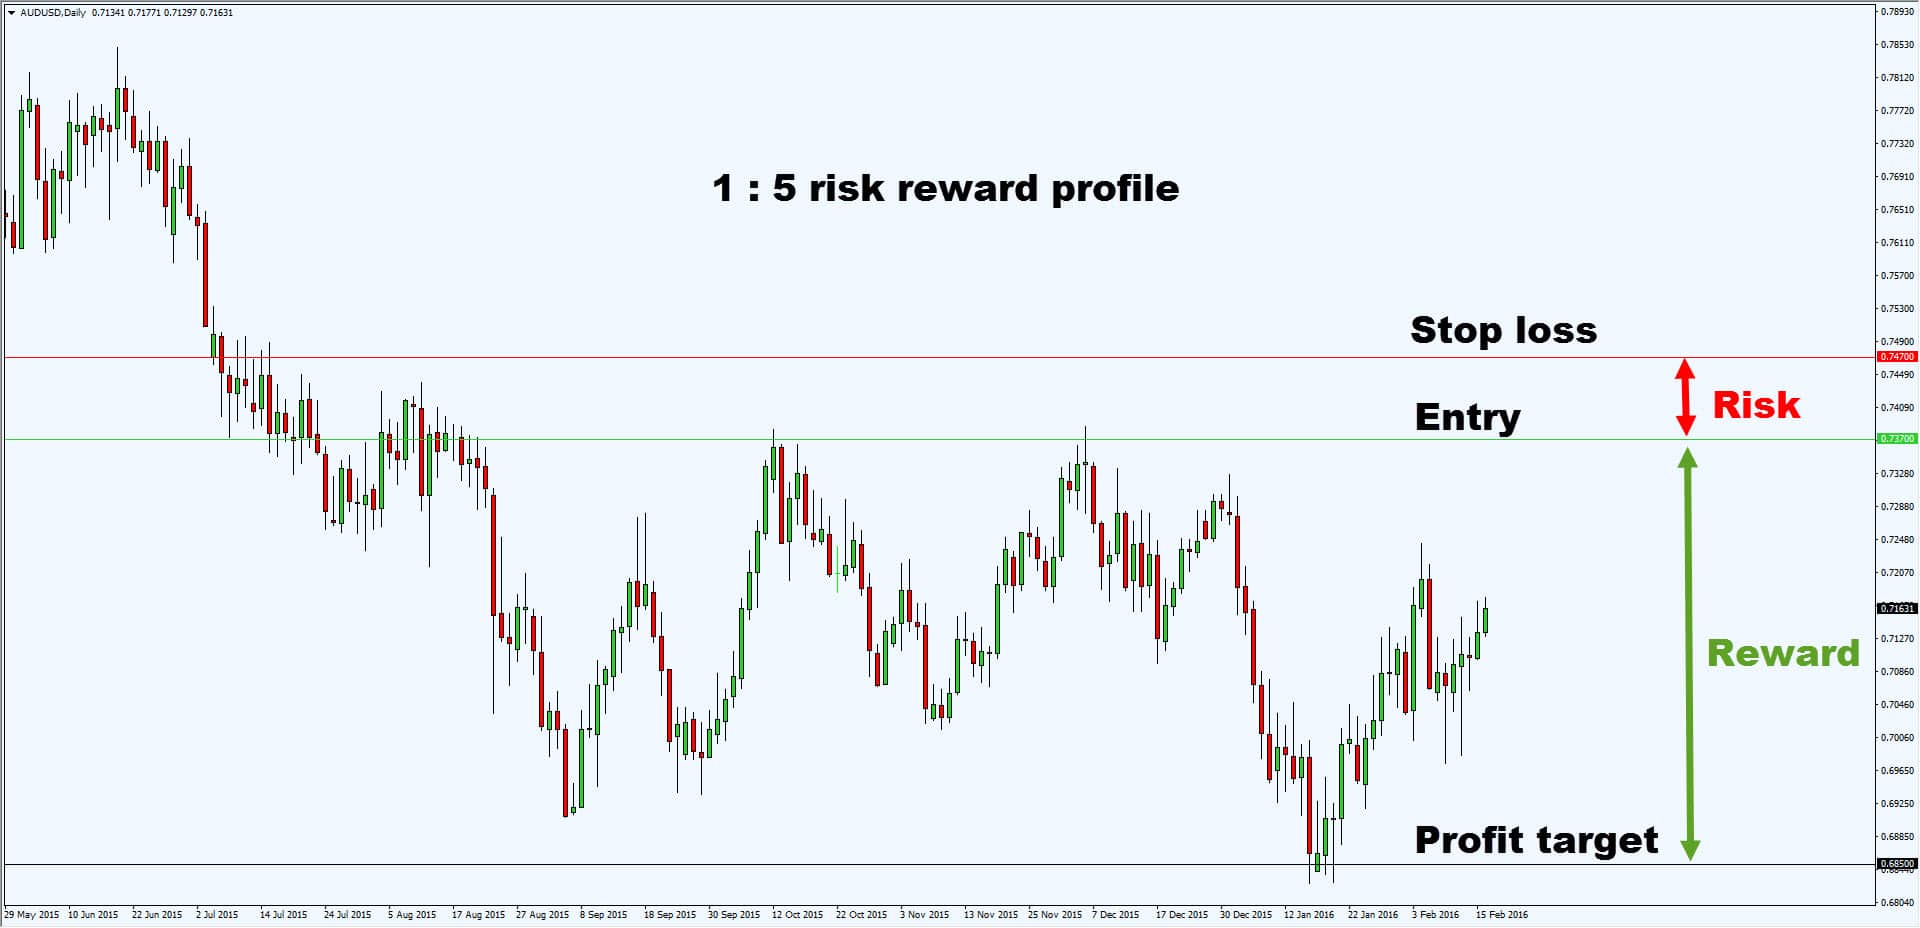
If you enter trades at support & resistance, it would greatly improve your risk to reward.
Here’s what I mean:
Pro tip:
The risk to reward profile is only one side of the equation. The other thing you need to take into account is the probability of your trade working out.
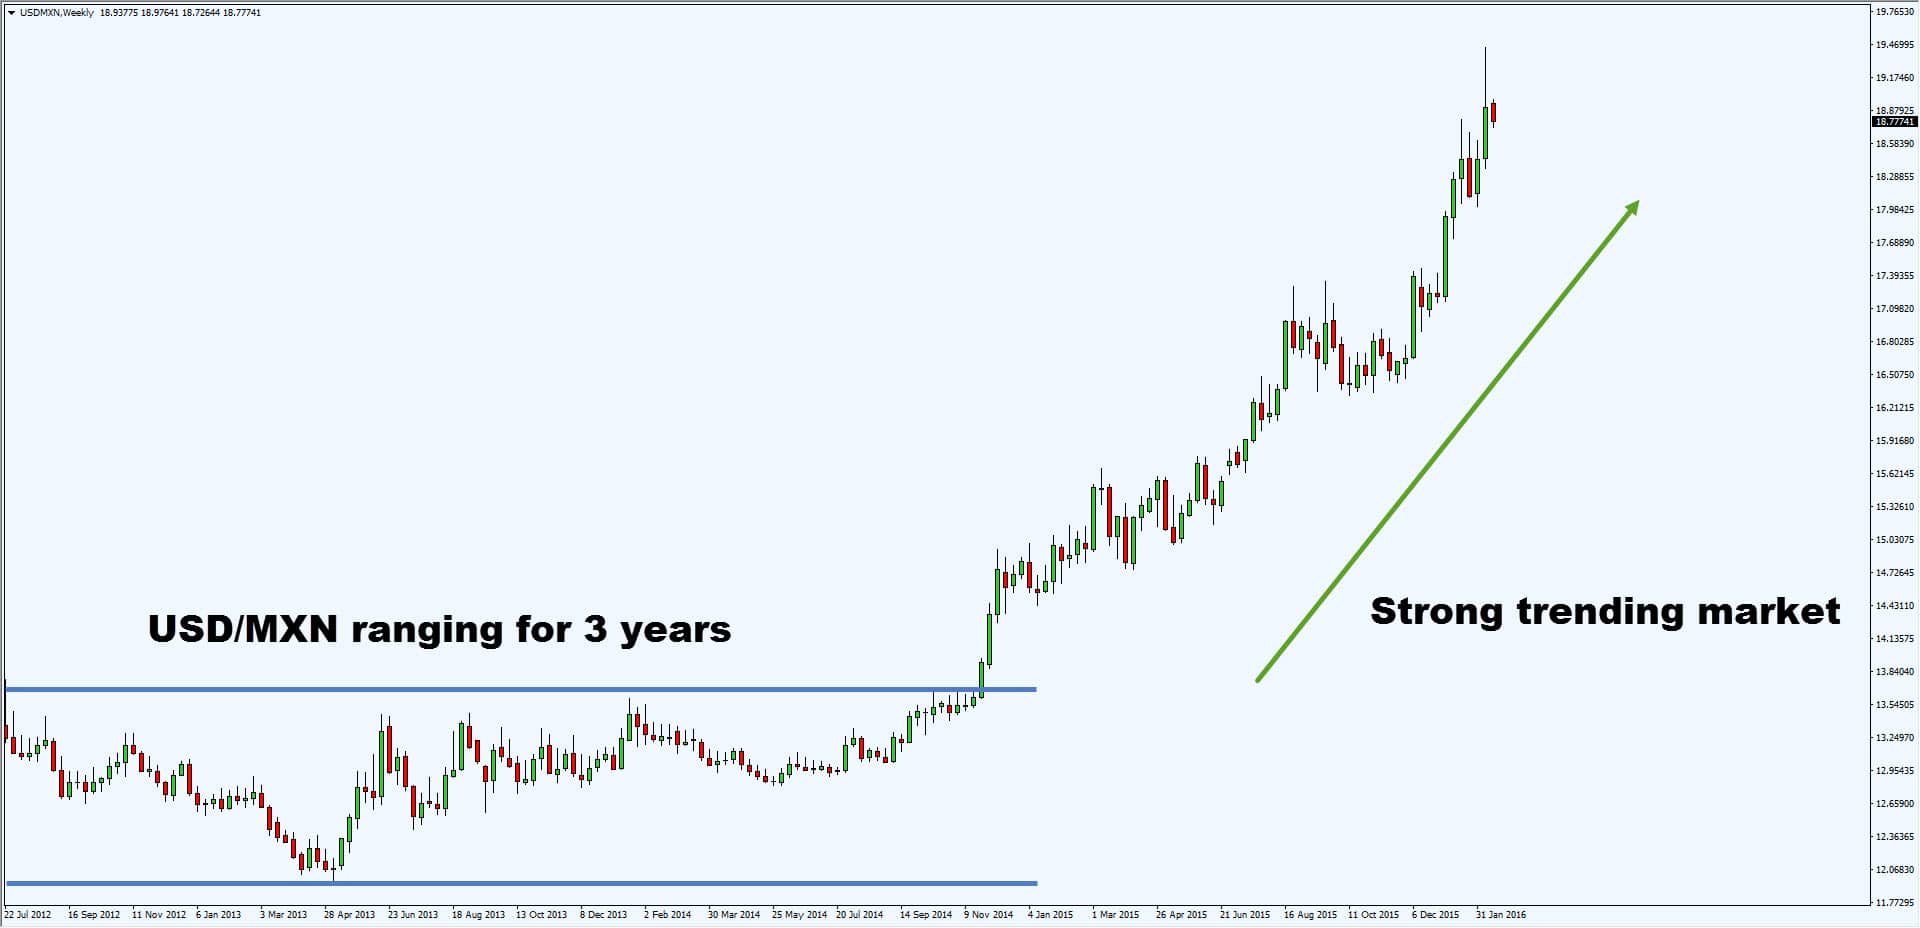
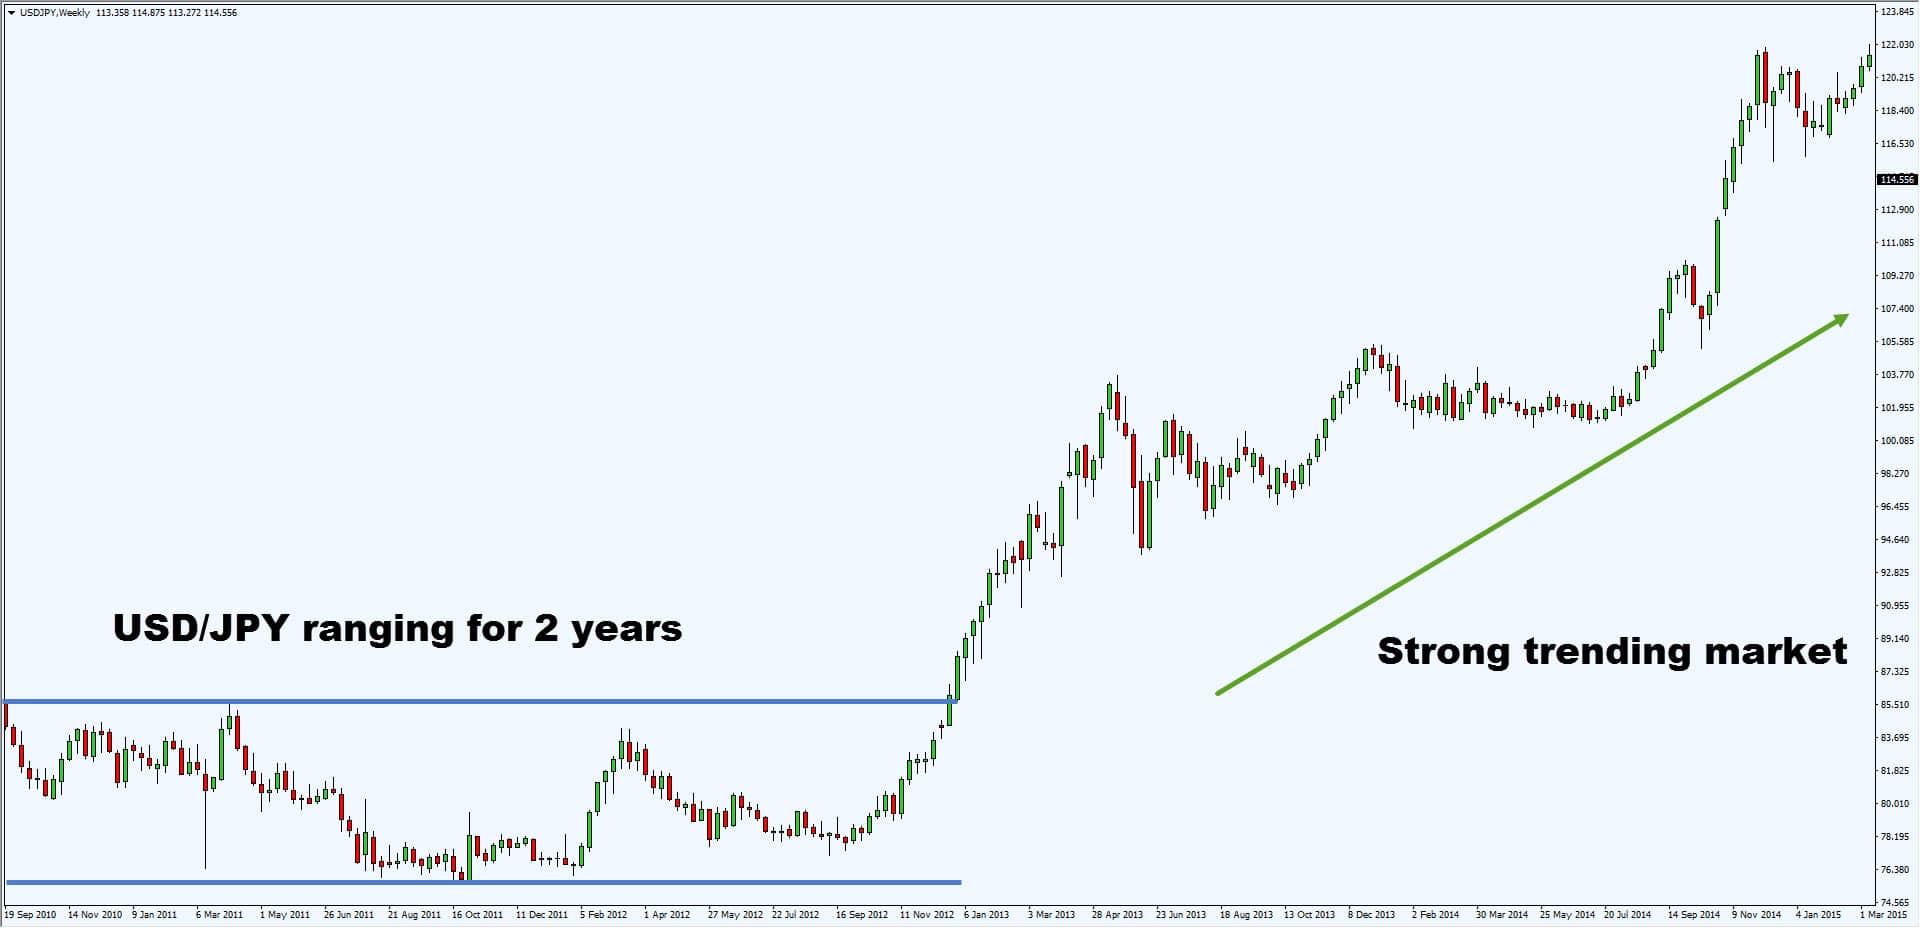
4. The longer it ranges the harder it trends
If there is a sudden range expansion in a market that has been trading narrowly, human nature is to try and fade that price move. When you get range expansion, the market is sending you a very loud, clear signal that the market is getting ready to move in the direction of that expansion. – Paul Tudor Jones
If you notice the price has been ranging for a long time, you’re not alone.
Traders all around the world will be seeing the same charts as you.
Some will be queuing to short the resistance, and some will be trading the breakout.
If the price does trade above the resistance, shorts will get squeezed, and breakout traders will hop on the bandwagon.
That’s why price trend for a sustained period of time, due to the imbalance of buying/selling pressure.
Here are a few examples:
You’re probably wondering:
I don’t have the patience to wait this long. I want to capture big moves in the market, now.
And this is what I’ll cover next…
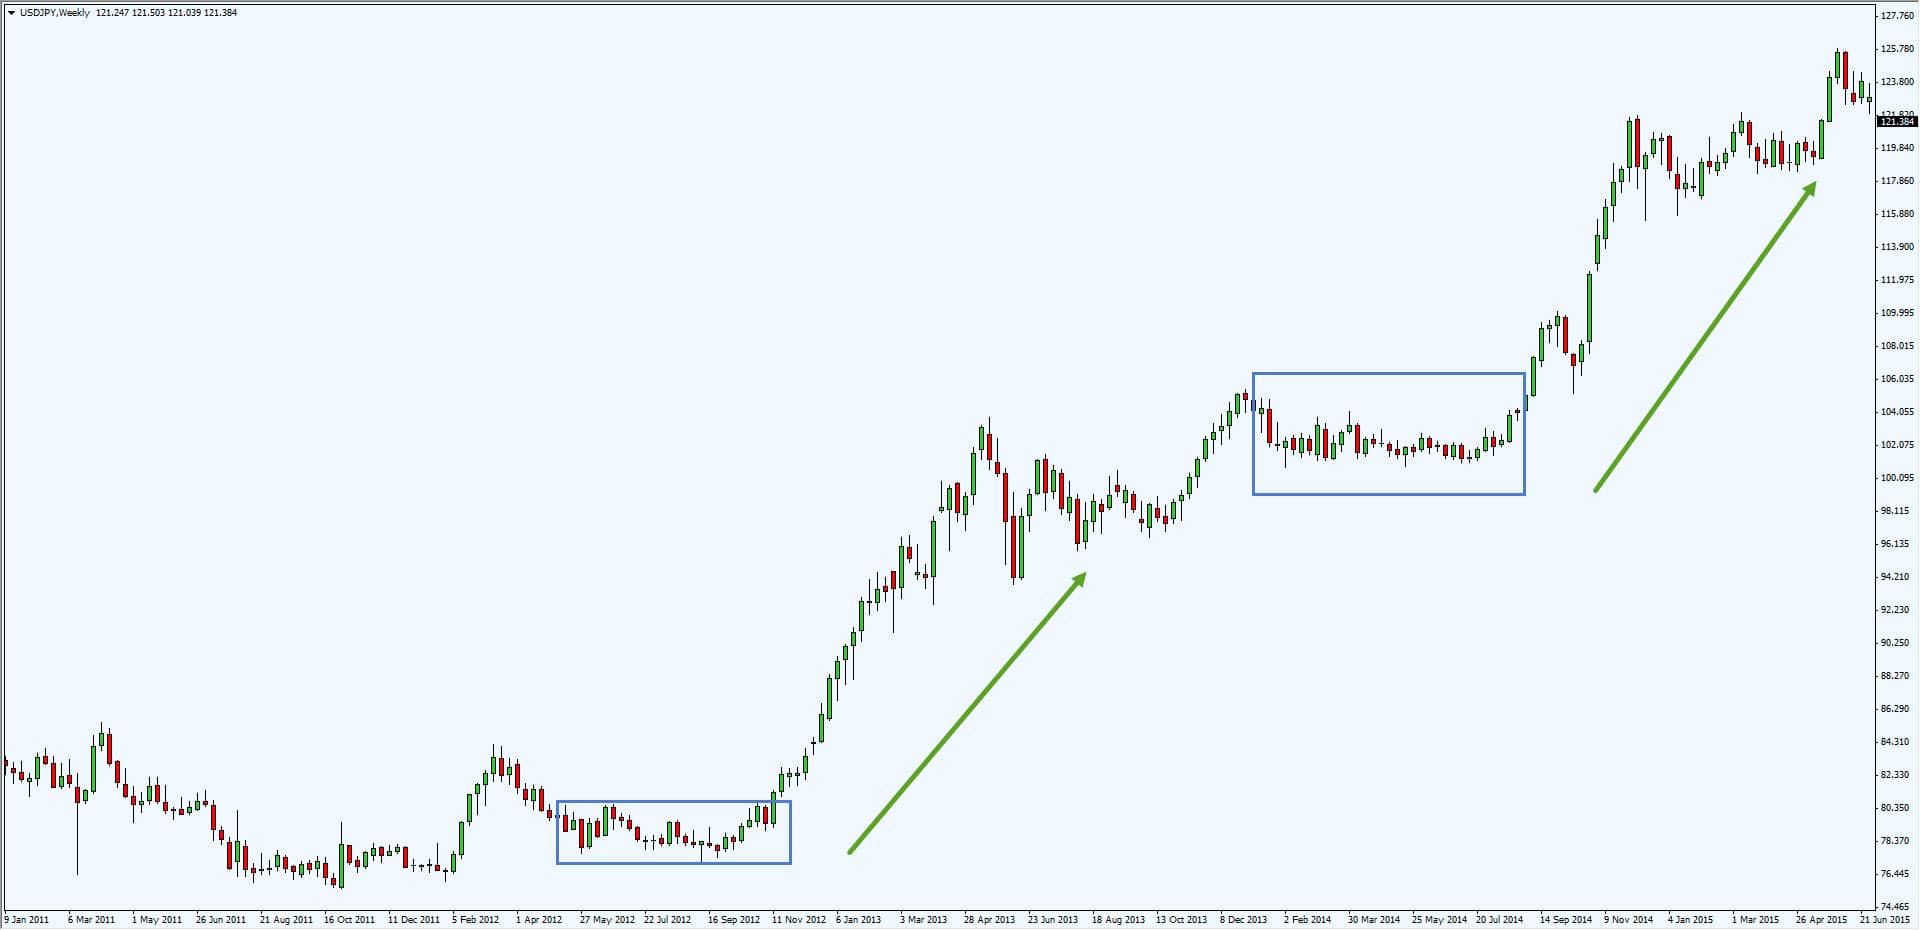
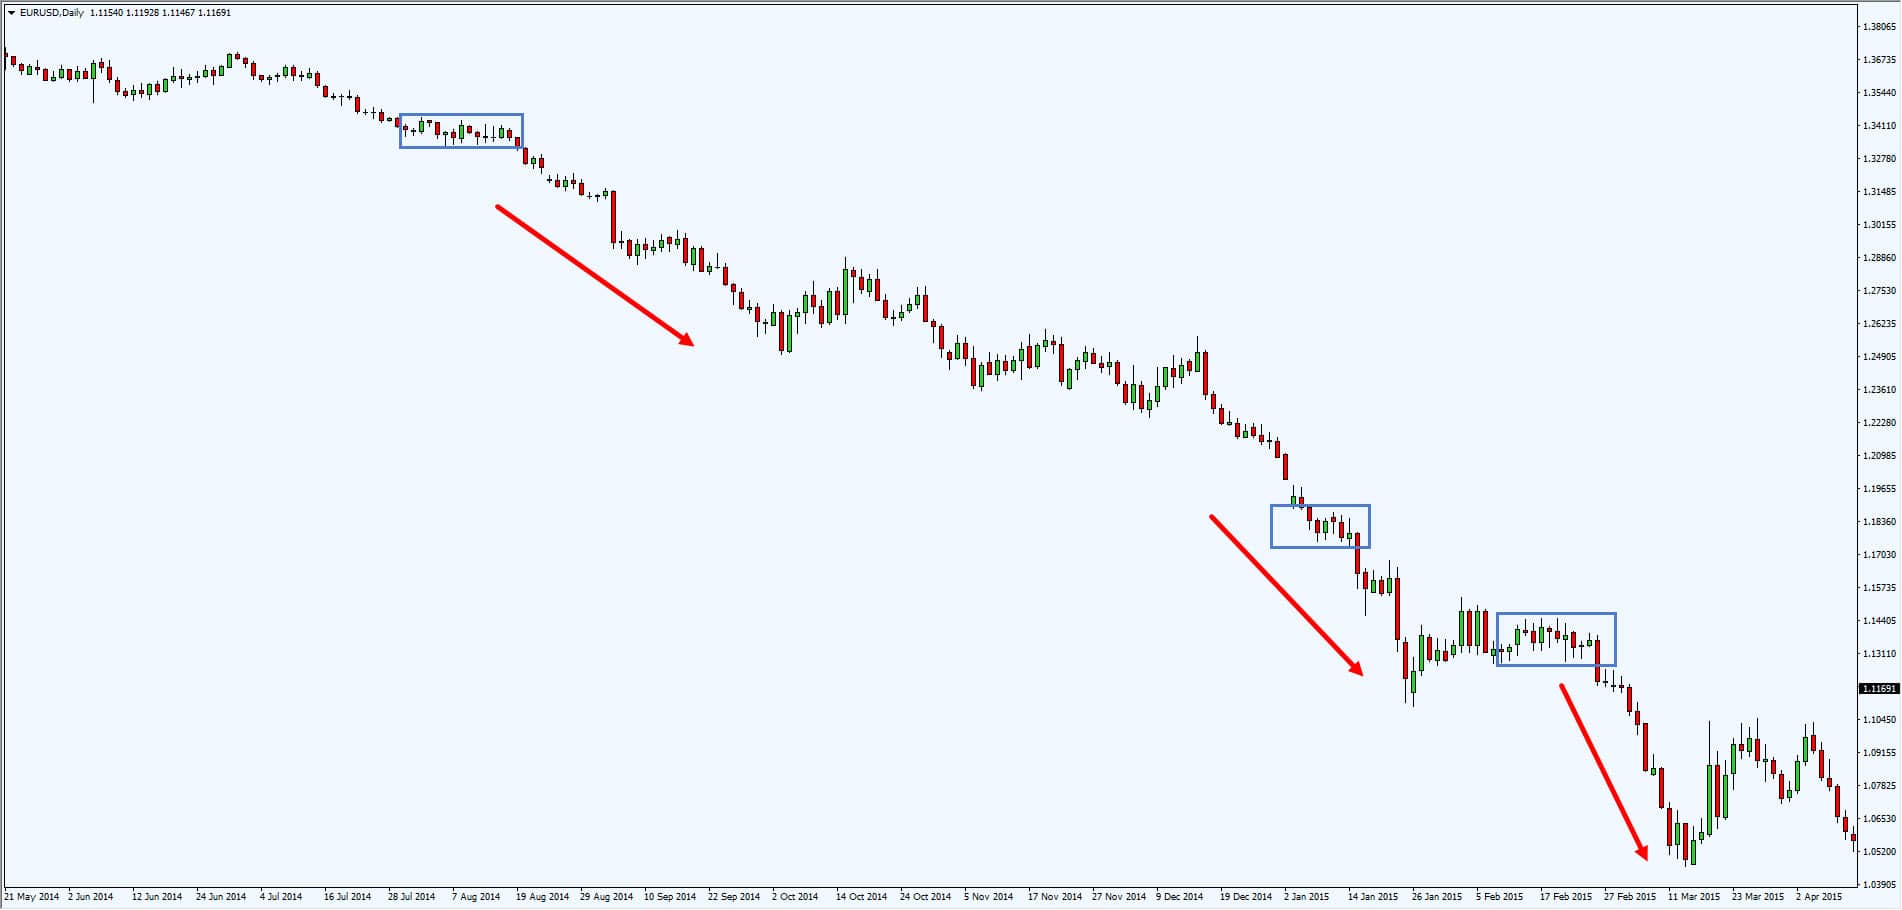
5. Narrow range candles usually lead to explosive moves
You’ve learnt that the longer price range, the harder it’ll trend. Now, you can take this concept further and apply it to the range of candles (instead of time).
The thing you’re looking out for is… narrow range candles.
Why?
Because you can expect an explosive move to occur soon.
Here are a few examples:
So, when you get series of narrow range candles, get ready for an explosive move.
6. Wide range candles serve as “hidden” support & resistance
A wide range candle is formed due to an imbalance of buying/selling pressure.
This represents “hidden” Support & Resistance in the markets (known as Supply & Demand by Sam Seiden)
Here’s what I mean:
There are traders who swear by Supply & Demand, and some who do just fine, with Support & Resistance.
Here’s the thing…
You don’t want to trade them in isolation, but use them with other technical tools, that add confluence to your trades.
7. False breakout provides one of the best entry to profit from “trapped” traders
First, let me explain what is a false breakout.
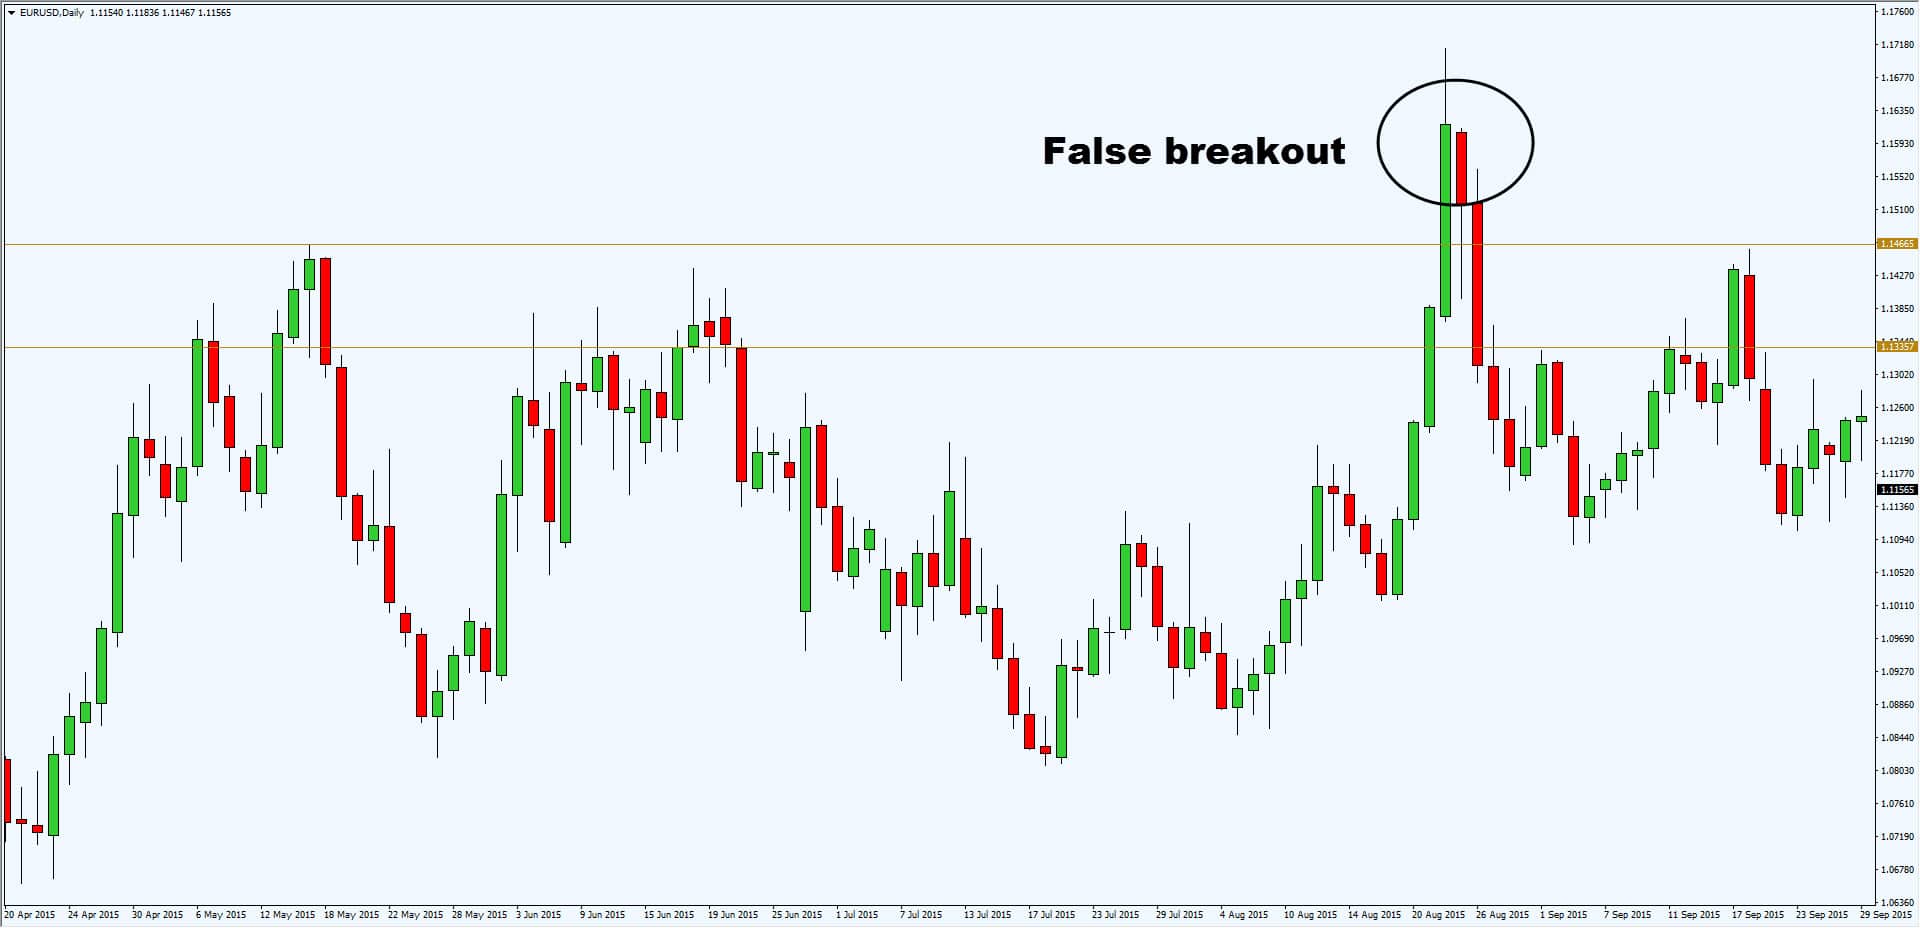
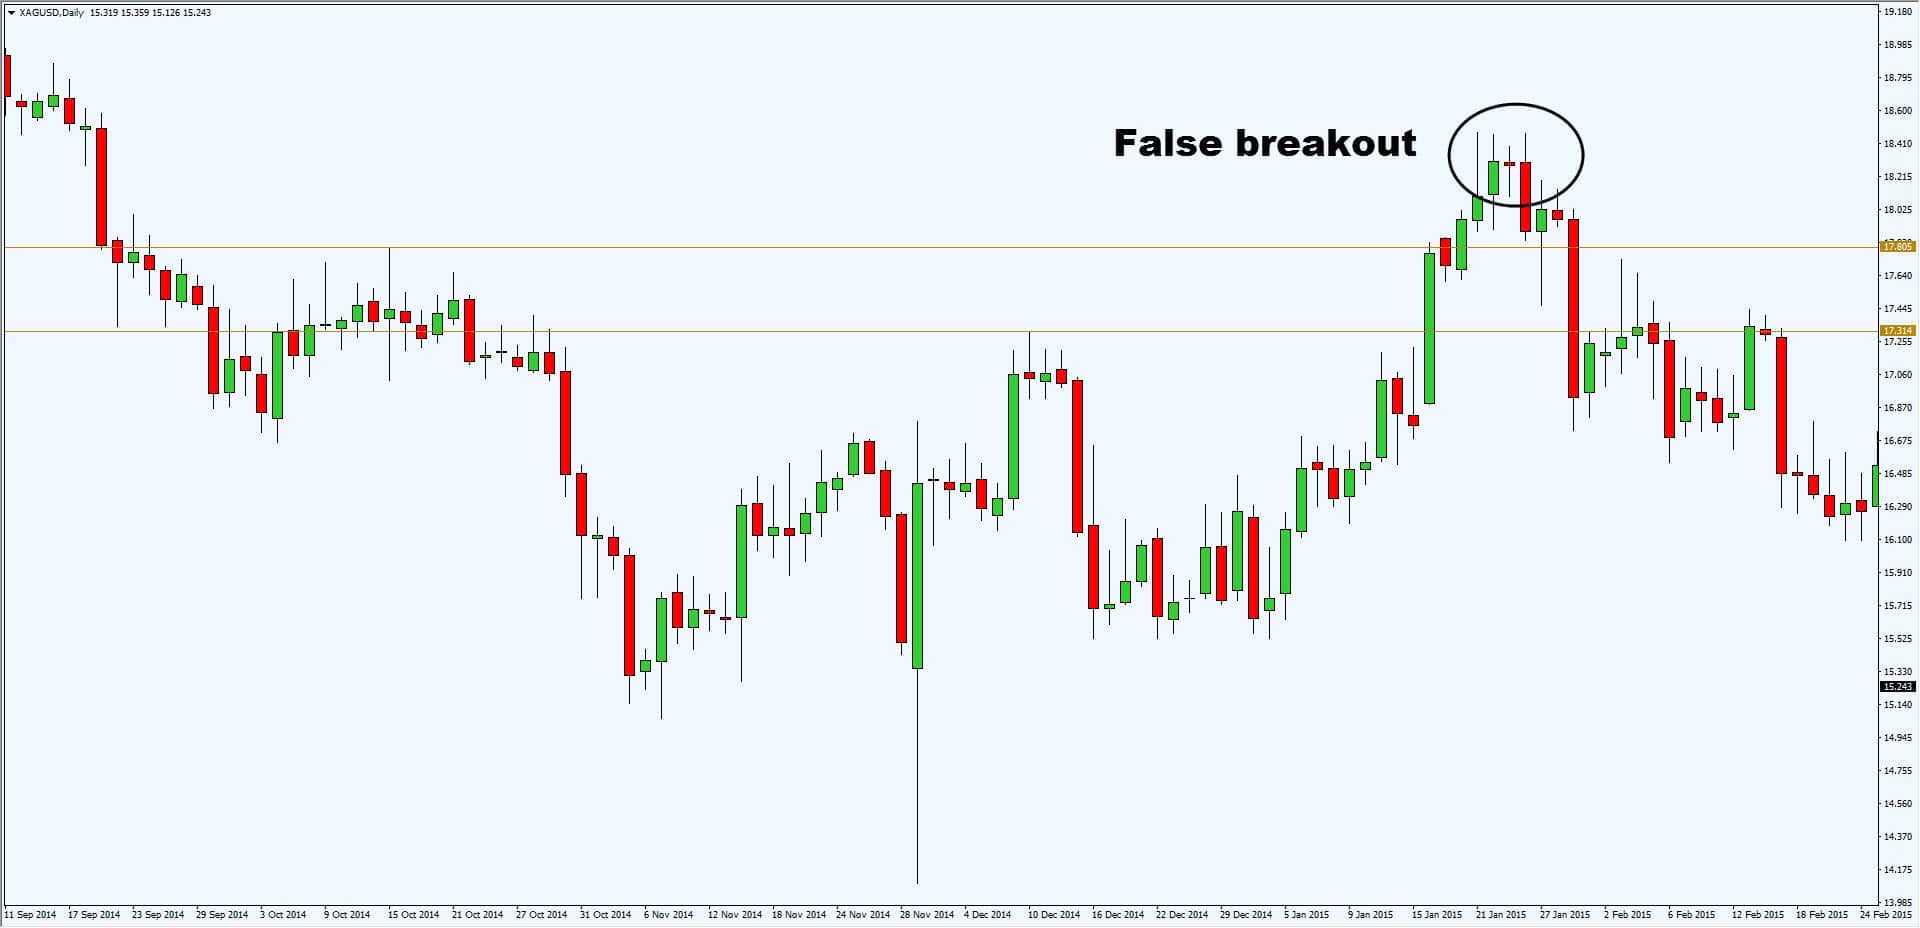
I define false breakout when price breaks support or resistance, only to close back into the range.
Here’s what I mean…
Why is this one of the best times to enter a trade?
Because you’re taking advantage of traders who are being “trapped”.
Imagine:
A trader, called Michael, went long on the break of resistance because he expects a rally.
After a few candles, price traded against him and closed under resistance.
At this point…
Michael is “trapped”. And chances are, there are many traders like Michael, who took the same breakout trade and are “trapped”.
Now, a proficient trader can take advantage of this.
How?
By shorting the false breakout, with expectations that the “trapped” traders would cut their trade, and fuel further price decline.
And this my friend is the power of false breakout.
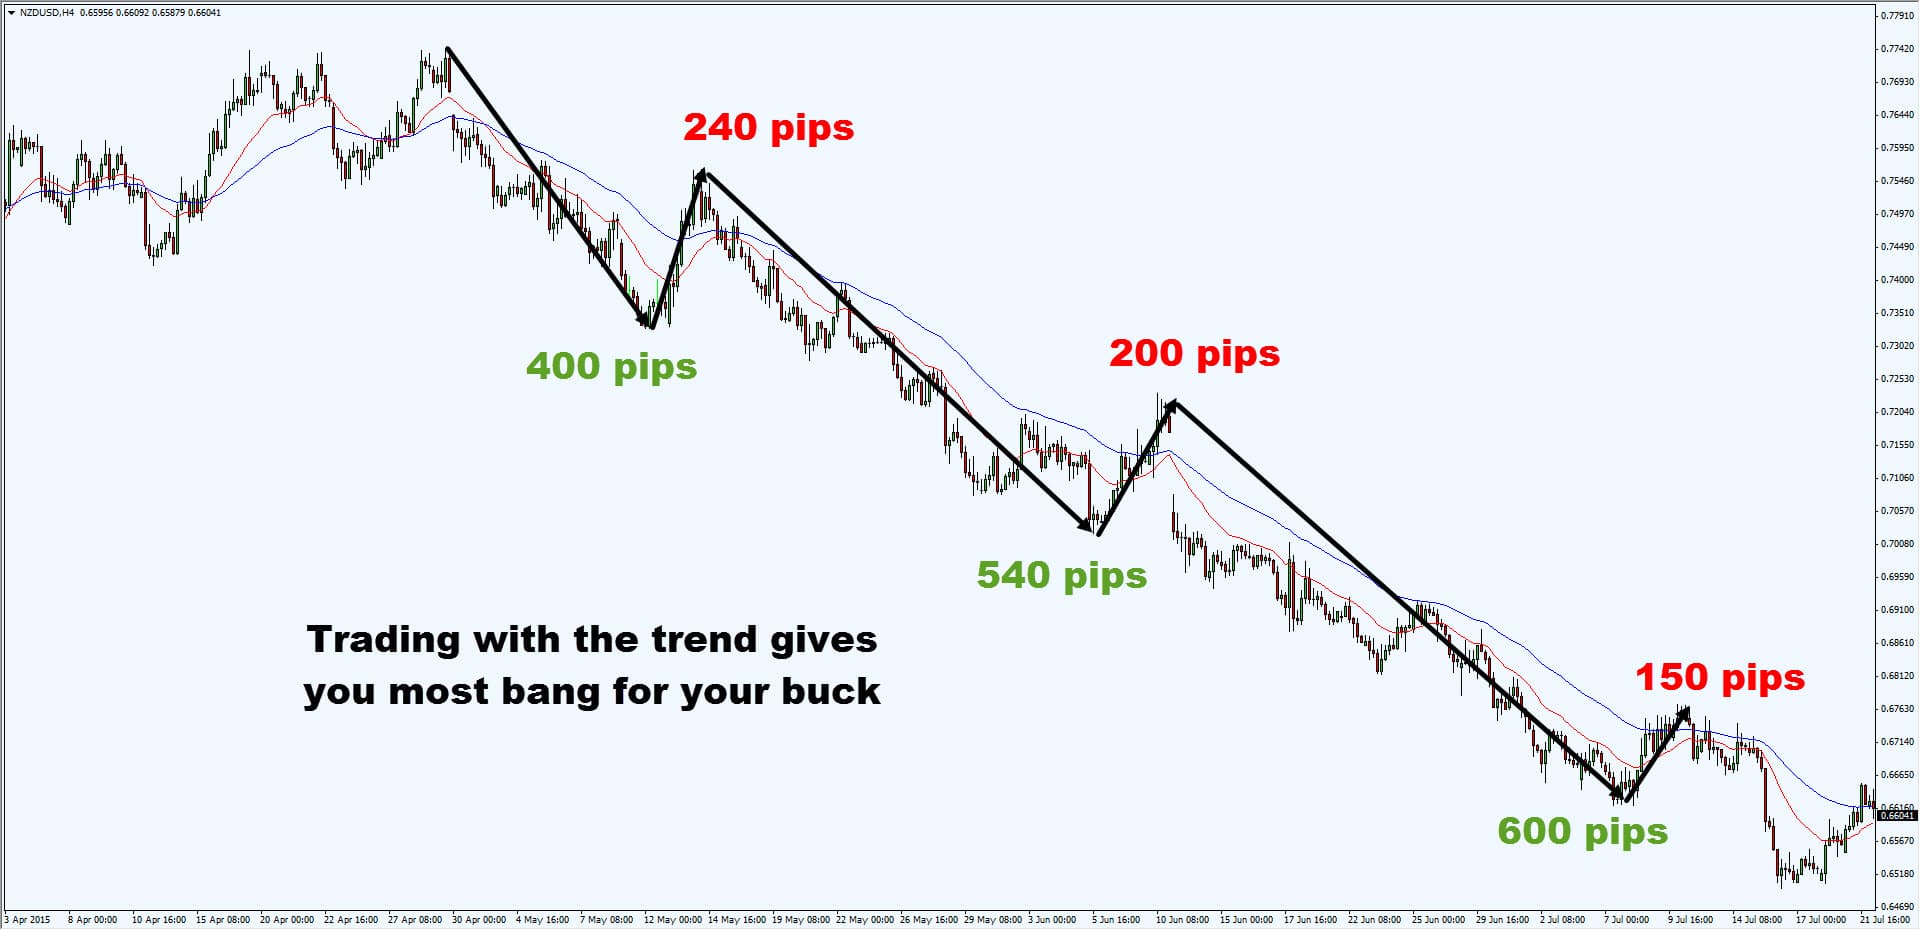
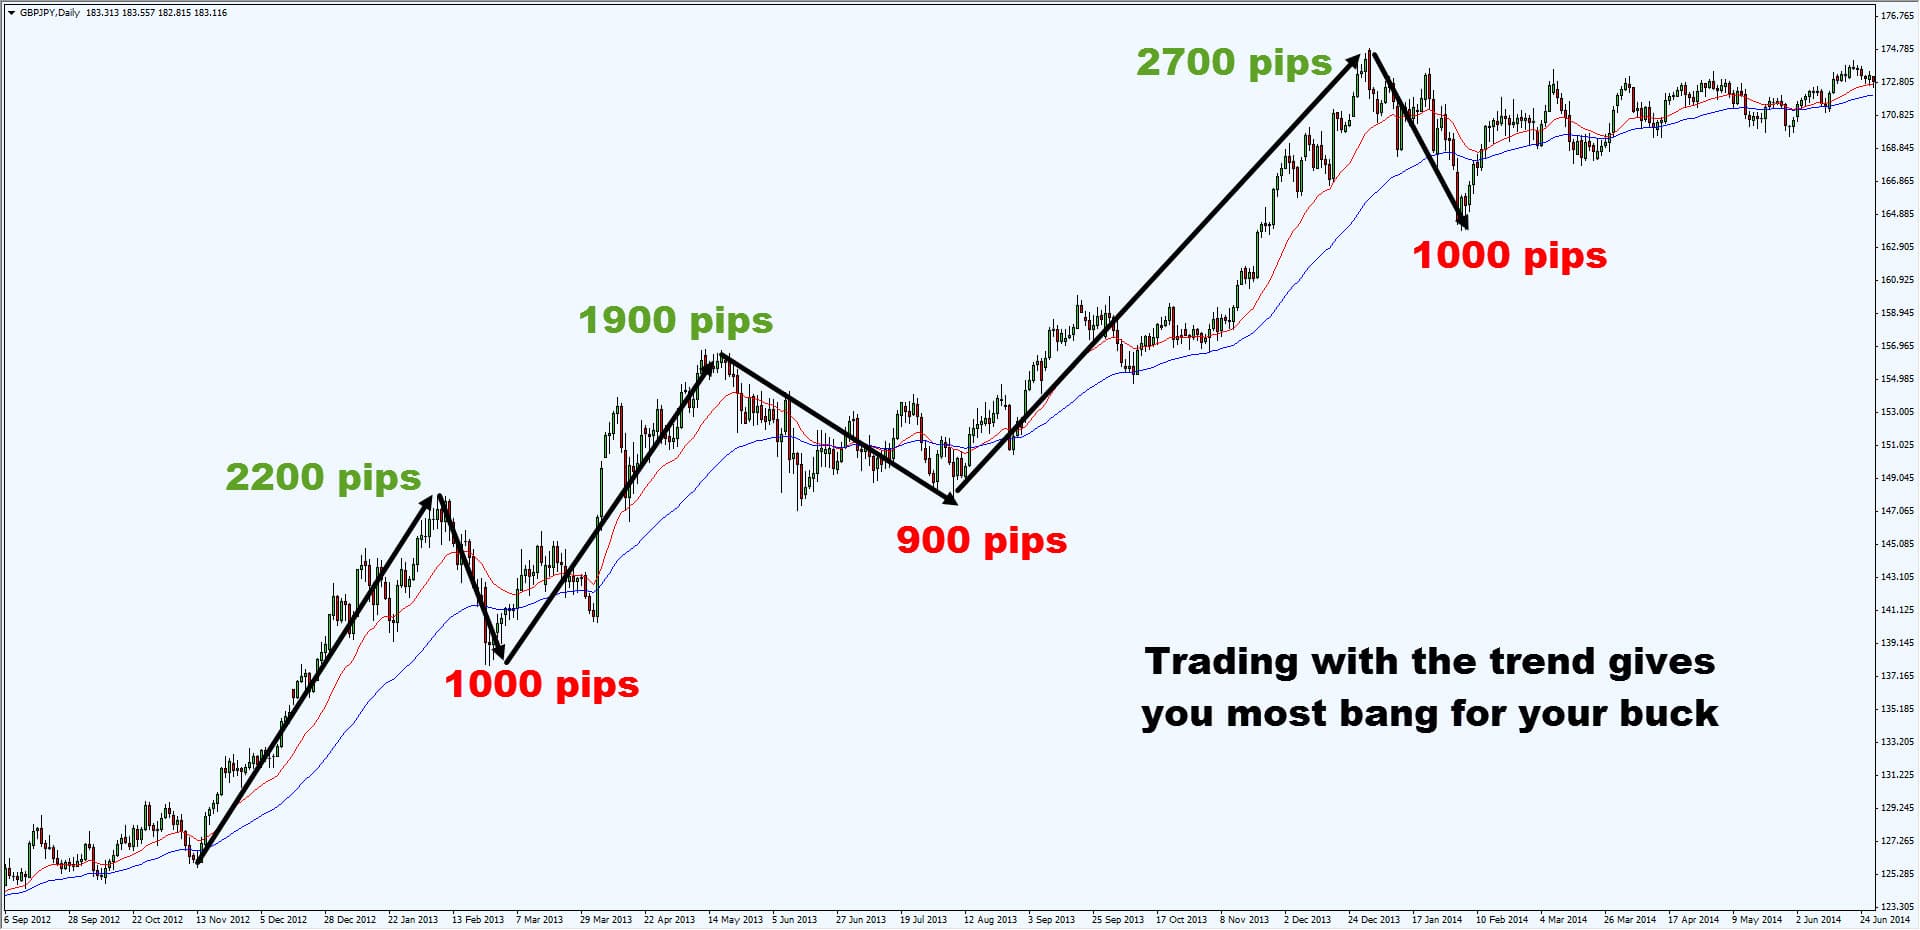
8. Trading with the trend gives you greater profit potential
A mistake made by many traders is that they become so involved in trying to catch the minor market swings that they miss the major price moves. – Jack Schwager
One of the best ways to improve your trading performance is, trading with the trend (and not against it).
This greatly increases the odds of your trade working out, and gives you a greater profit potential.
Here’s what I mean…
Now…
If you want to learn how to define a trend, go watch this training video below:
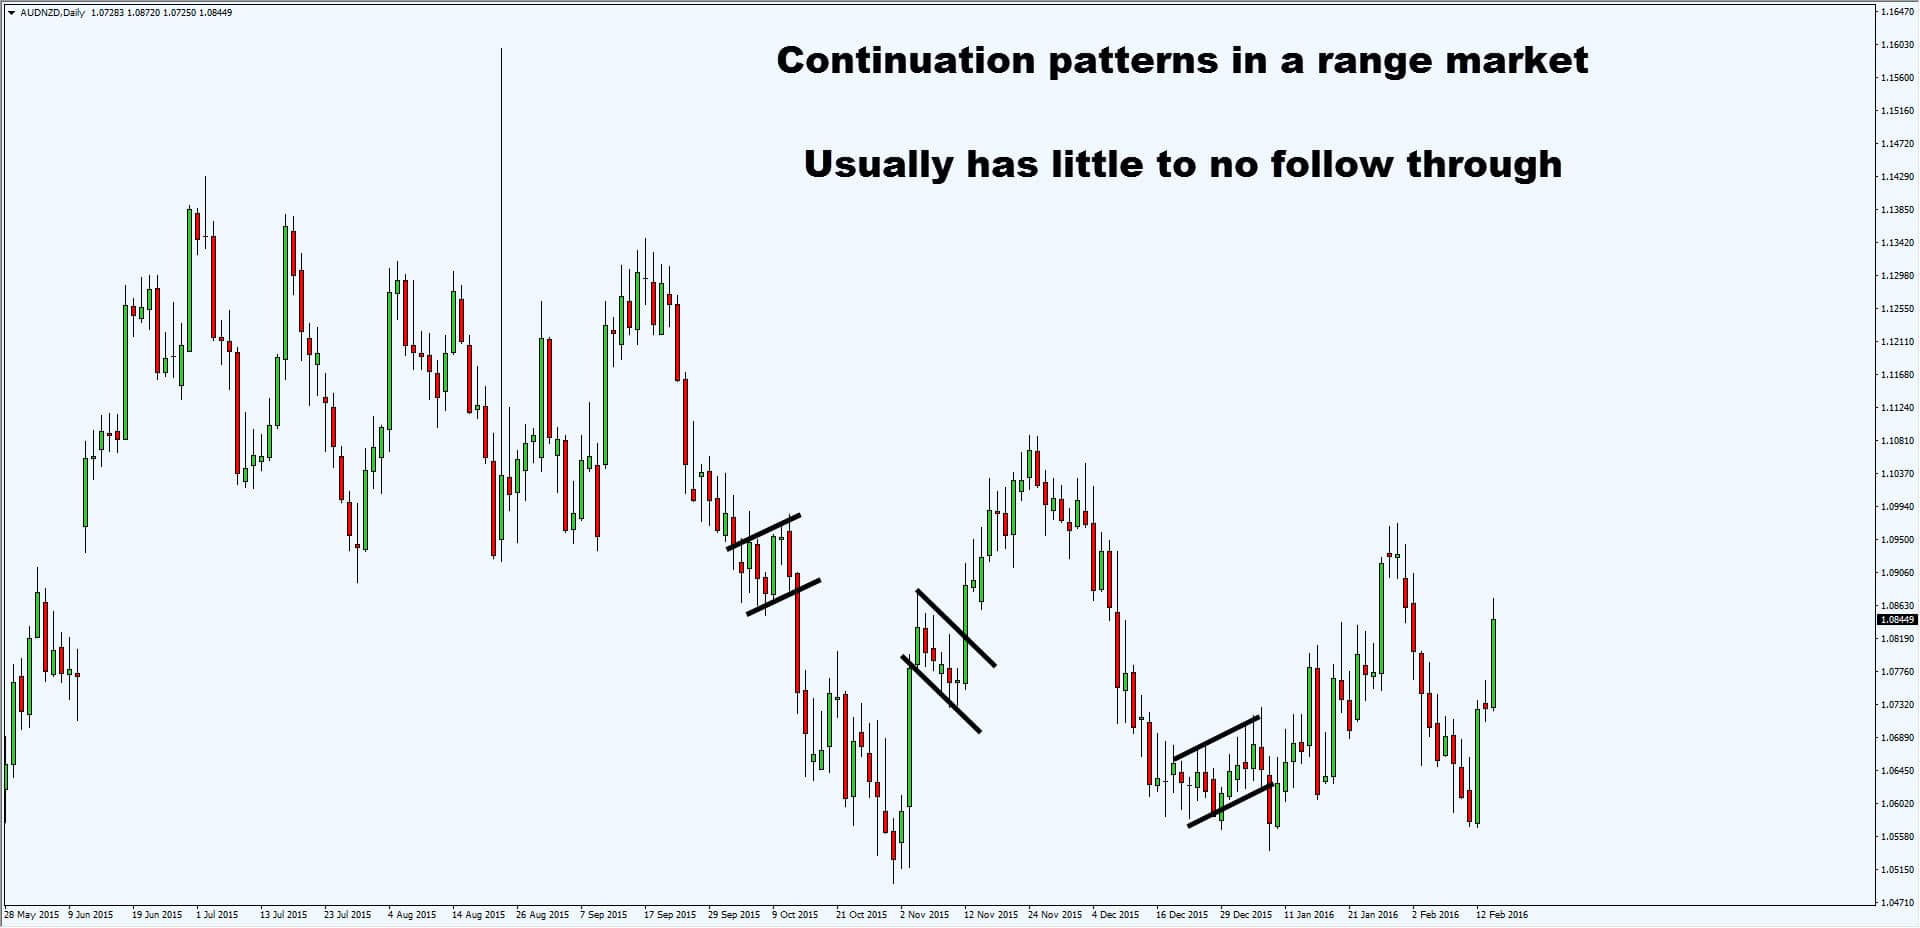
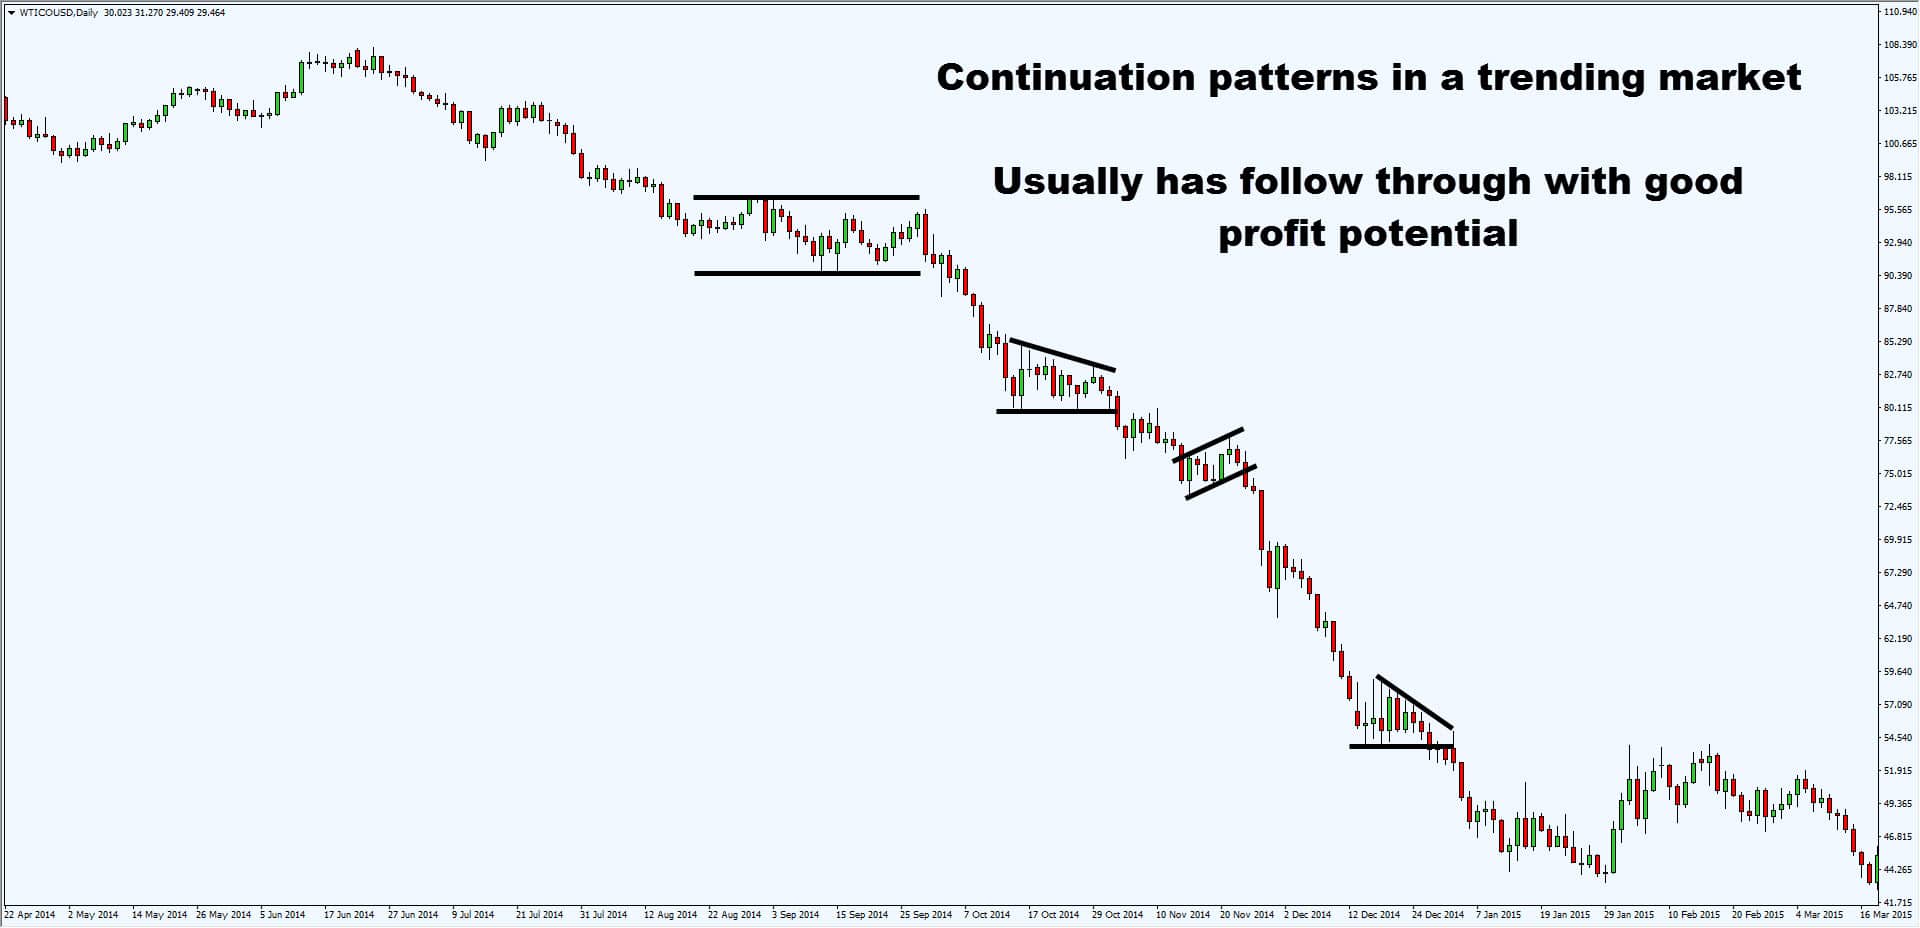
9. Continuation patterns work best in trending markets
You may wonder:
What are continuation patterns?
They’re chart patterns such as flags, pennants, triangles etc.
And…
A big mistake traders make is, to trade these patterns in a range market.
An example:
So, when is the best time to trade continuation patterns?
…
…
…
You guessed it, in a trending market.
An example:
Moving on…
10. How to tell when a trend is ending
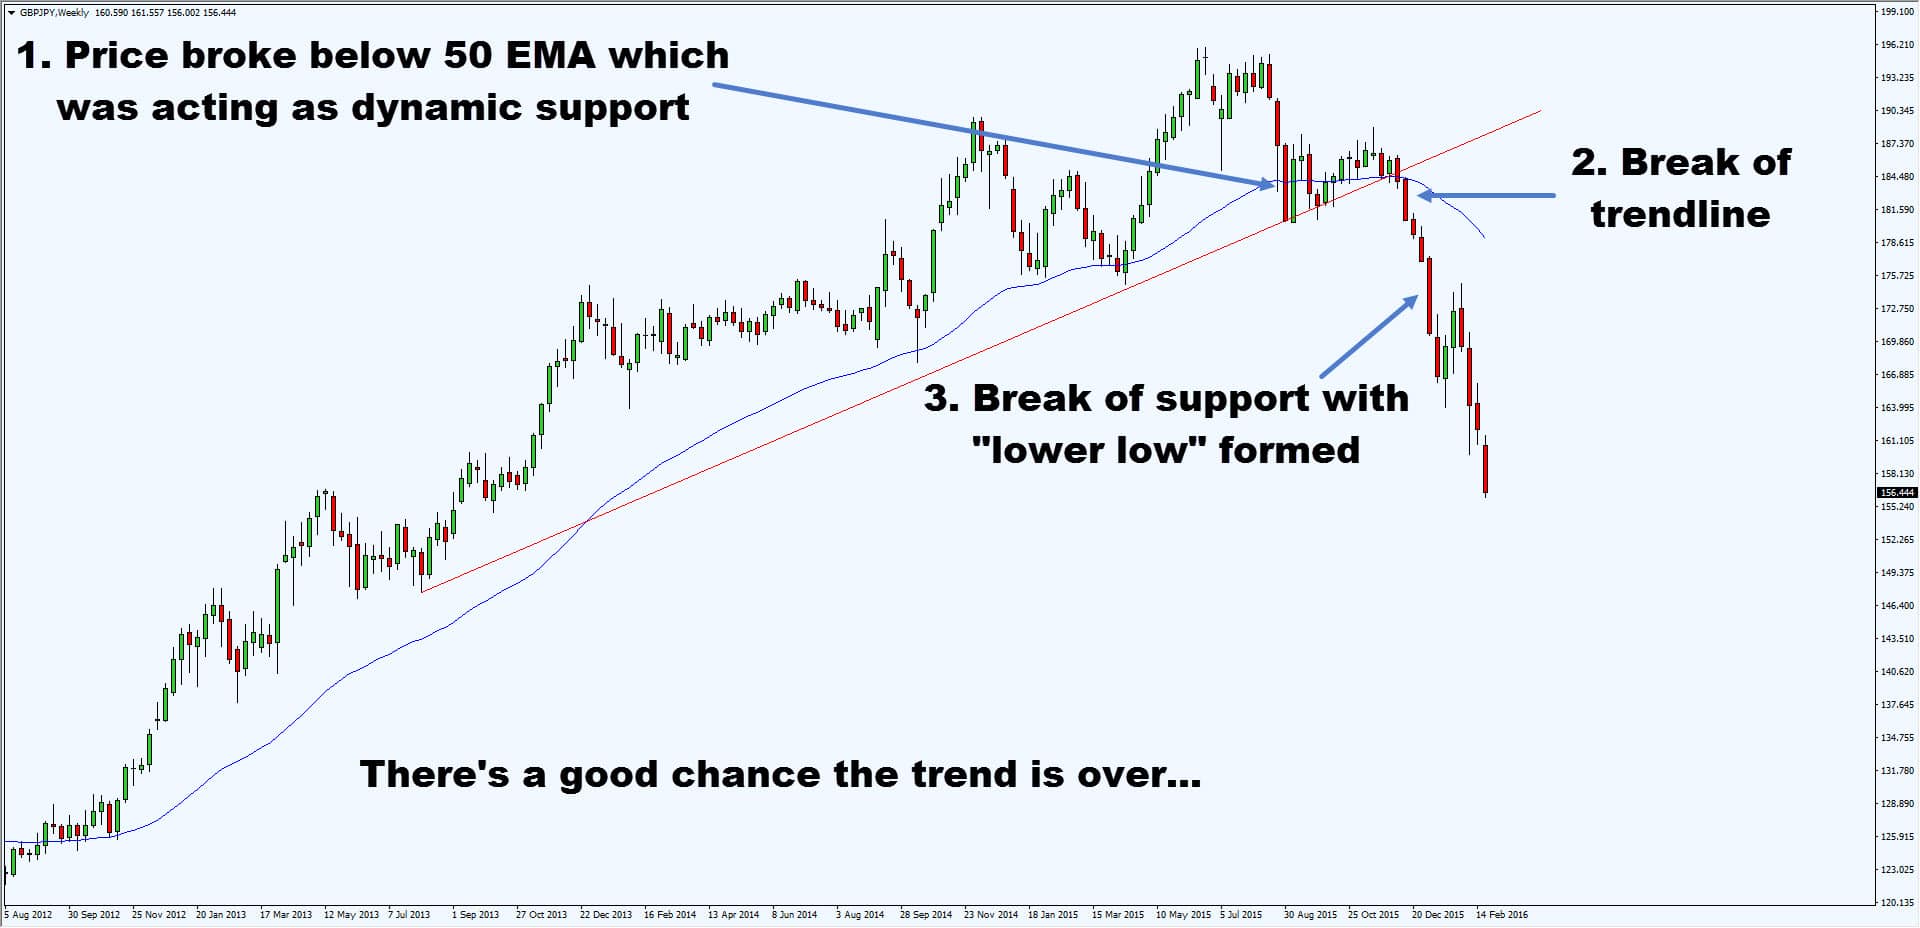
These are 3 things I’ll look out for:
A “respected” moving average is broken
Break of structure
Break of trendline
An example:
Let’s look it one by one…
Price broke and closed below the 50 EMA, which was a dynamic support that has been “respected” by the markets
Price broke and close below the trendline
A new structure low in the market is formed. Now you’ve got a lower high and lower low
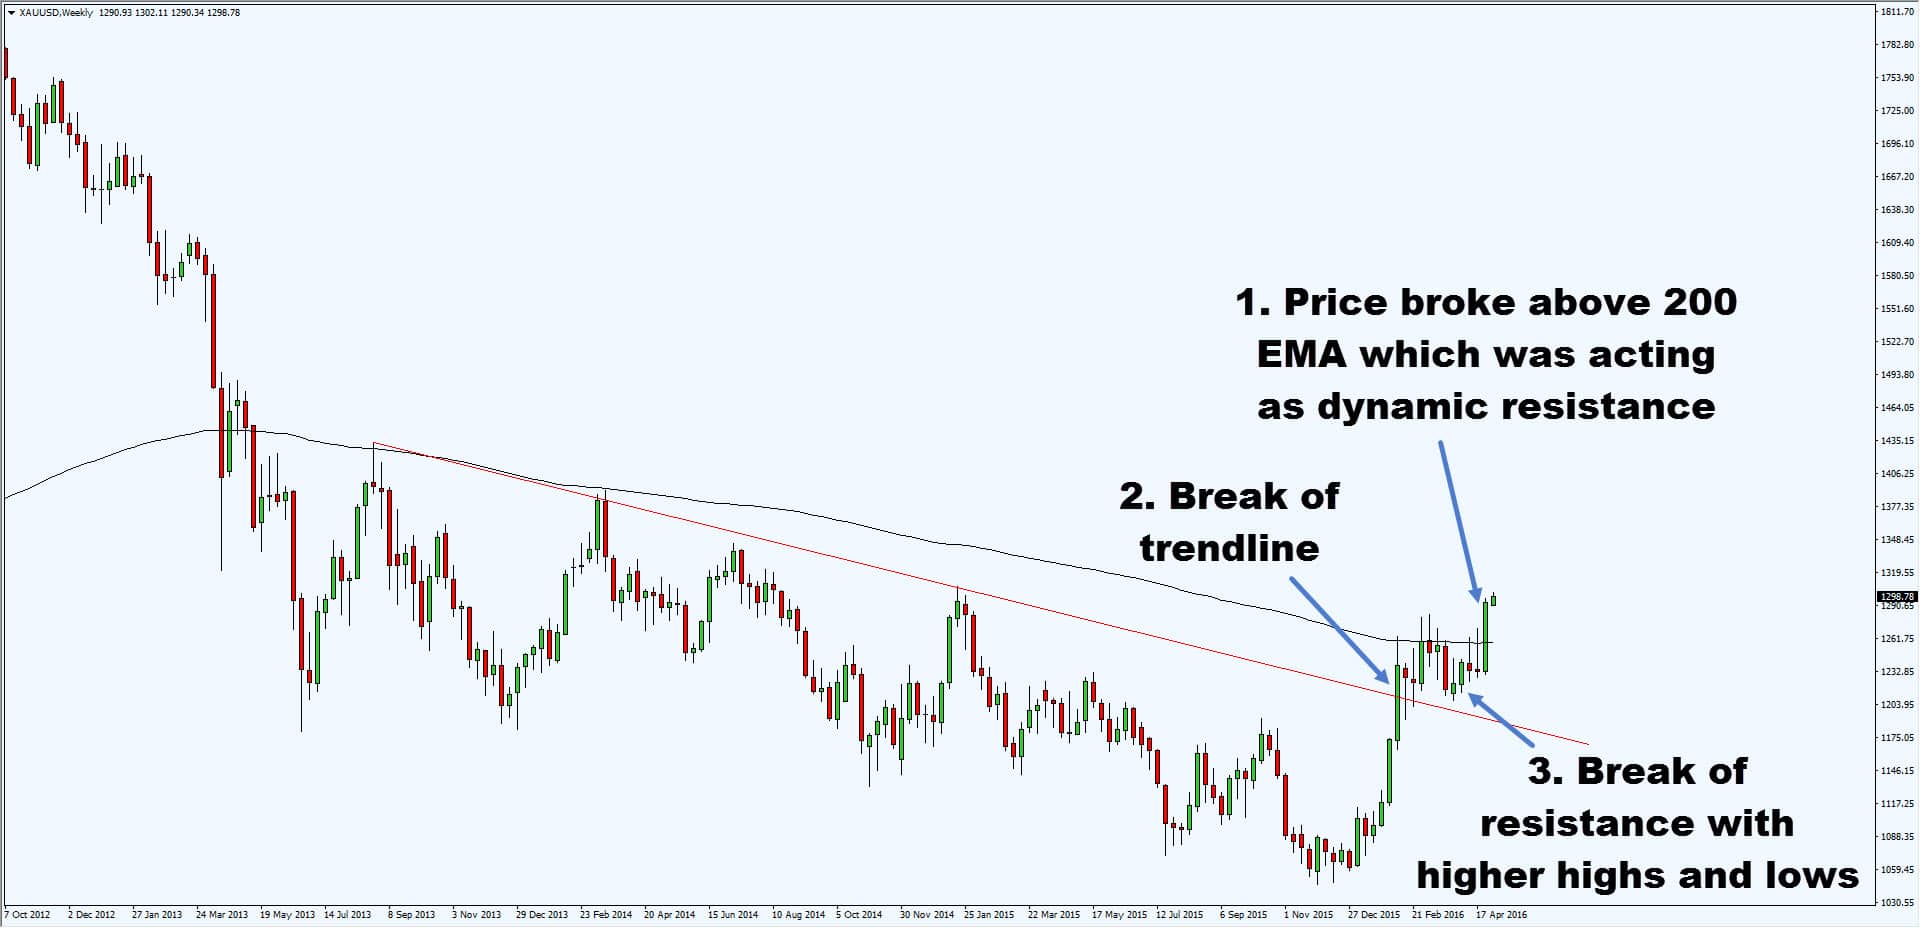
When you’ve got all 3 factors lined up, it increases the odds that the trend is over.
Here’s another example:
To recap, these are 10 price action trading tips you’ve learned today…
Avoid trading when the market is far away from the moving average
Support & resistance helps you identify areas of value to trade from
Trading at support & resistance gives you favorable risk to reward
The longer it range the harder it trends
Narrow range candles usually lead to explosive moves
Wide range candles serve as “hidden” support & resistance
False breakout provides one of the best entry to profit from “trapped” traders
Trading with the trend gives you greater profit potential
Continuation patterns work best in trending markets
A break of structure, trend line, and moving average usually indicates the trend is coming to an end
If someone had shared these with me when I first started out, it would have reduced my learning curve, and saved me a ton of frustration.
Now, if you found this post useful, then you’ll also enjoy The Ultimate Guide to Price Action Trading (where you’ll learn additional trading tips & tricks you’ll not see elsewhere). Go download it and let me know what you think.
In the meantime, I wish you good luck and good trading. I’ll talk to you soon.
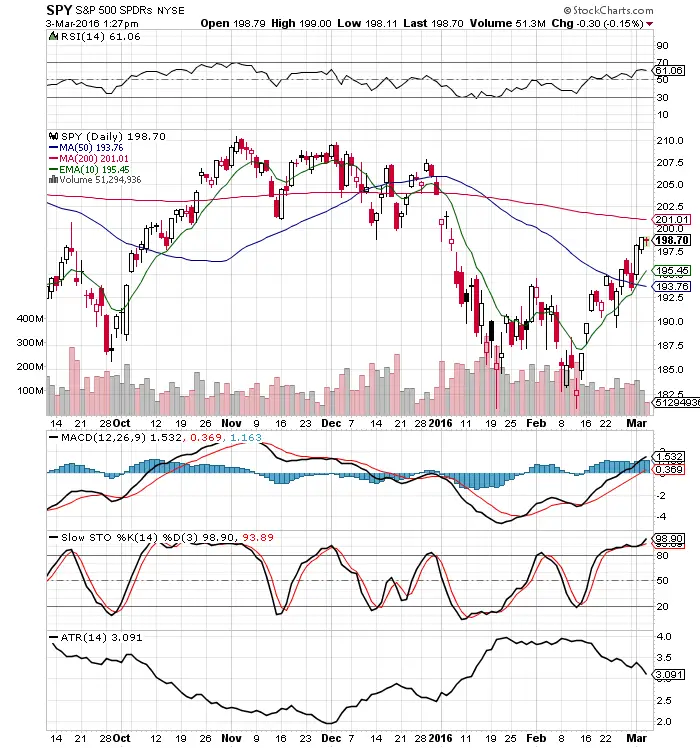
Signals help traders filter out their opinions and focus on price action. These tools help capture trends in your own time frame.
The 200 day SMA measures the long term trend. Price above long term bullish, prices below signal long term bearish.
The 10 day EMA measures the short term trend. Price above short term bullish, prices below signal short term bearish.
The MACD crossover can signal an intermediate swing trade.
The Slow Stochastics crossovers can signal short term reversals in the trend.
A declining ATR shows volatility decreasing and an ascending ATR shows volatility increasing. This is a signal to help calibrate position sizing.
The RSI shows the risk/reward ratio increasing and decreasing. The 30 RSI favors the bulls risk/reward for entry and the 70 RSI favors the short sellers risk/reward ratio.
The magic of these trading indicators comes when you combine them to create your own trading methodology that fits your own risk tolerance levels and then trade your system with the right risk management and discipline.
Gaps in prices can be one of the strongest indicators of momentum and while many are using gaps as an opportunity to get out of a winning trades many times it is a great entry signal and beginning of a strong trend in the direction of the gap. Gaps work best in growth stocks especially after earnings are reported when they go into an accumulation phase but also at times in indexes as well as equities as an asset class go under accumulation. A gap signals momentum and that nobody is even willing to make a trade in the hole that is created in the chart.
Gaps can be bought at the open for a possible quick gain and good entry but there is still a possibility that the gap could collapse and those are violent but the odds are that the right leading stock will continue in the direction of the gap. Better odds are to wait for the gap to hold for the first hour of trading then make an entry, you may get a better entry on a pull back and avoid being caught if the gap fails and price collapses. I like to buy gaps at the end of the day for the highest probability that it is a gap and go and not a gap and crap.
Gaps in high volatility do not tend to hold and trend as well as a gap out of a clean price base.
A gap off a key moving average or that opens over a key moving average has a better chance of success than a random gap.
A gap into all time highs is especially powerful with all holders now in a profit and tend to just let the profits run.
Shorts caught in gaps can add fuel to the fire of the trend as they are forced to buy to cover.
A great place to set a stop is just under the low of the gap up day, price should not breach that level if it is going to trend. Using and end of day stop gives you better odds of not being shaken out if it just dips there temporarily.
After the low of the day holds and a trend begins over multiple days then the trailing stop could be moved to the 10 day sma and then the 5 day ema to lock in profits but allow the trend to continue in your favor. On a very volatile stock some your the 21 day ema or 20 day sma as a trailing stock to not be shaken out of a winner for me personally that is too far away.
Also be aware that a momentum growth stock that gaps up does not have long term resistance just pauses and higher highs, also overbought indicators are worthless in momentum growth stocks under heavy accumulation by money managers. RSI extremes can go farther than believed.
When caught on the wrong side of a gap against you it is best to just get out in the first 30 minutes, if the gap holds and makes higher highs after the first thirty minutes of the trading day it almost always just gets worse as the day goes on.
Gaps have a way of leaving so many retail traders on the sidelines because they think that was the move and they don’t want to chase. Some of my biggest winners were me buying into gap ups with the right position sizing and letting my winner run.
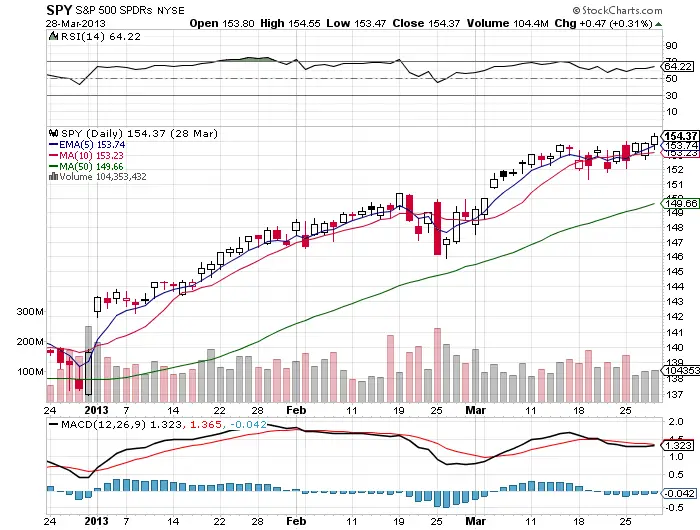
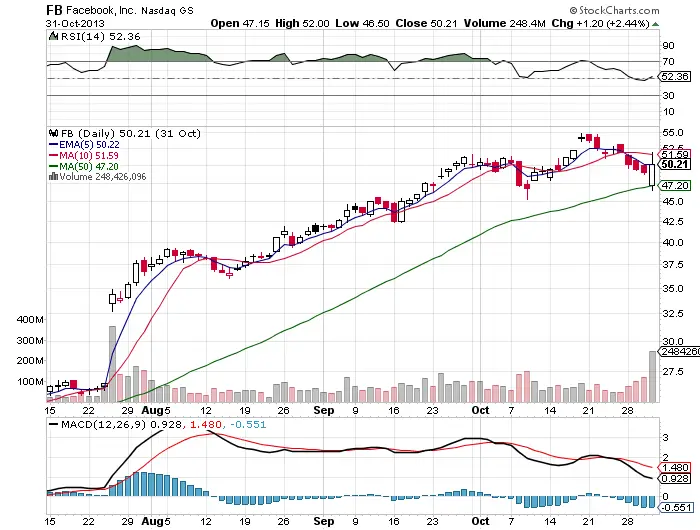
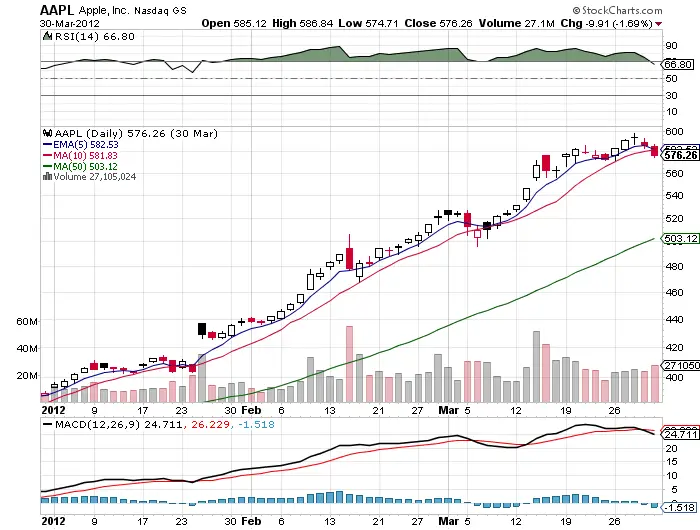
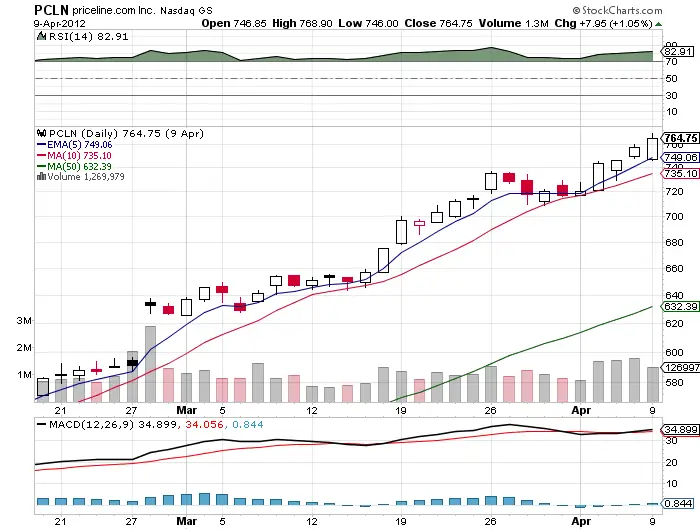
Here are four daily gap up charts I did trade successfully for profits some for big profits some for huge profits. I think it is a great exercise to look at the gap up day and see how it played out and how you would have played it for profits yourself.
For me the best indicator of a trend is simply price action as measured through using moving averages. Moving averages capture trends visually for the trader, going higher or lower based on the price itself. No only does the power of moving averages lie in their power to measure price trends but they are followed by the vast majority of technicians and traders and are used to make real trading decisions.
For me different moving averages mean different things, here are my personal definitions:
The 5 day EMA is an excellent signal to use for trading sharply trending markets and stocks. It is a great place to measure support in bull markets and resistance in bear markets.
The 10 day SMA give a little more room to not be shaken out of a trade and is excellent for keeping you in a trade if you use it as a trailing stop during trends.
The 20 day SMA for me is the reversion of the mean for a stock and can be used in range bound markets along with Bollinger Bands if that is your style.
The 50 day SMA is the key level of support for the market indexes and hot stocks during bull markets, it is the place to buy if we get a bounce and the place to sell short if it is lost and not recovered by the end of the day.
The 200 day SMA is the ultimate line in the sand between bull markets and bear markets. It is generally the place that the best stocks find support in any market. It is the buy point out of bear markets when it can be held for multiple days.
The price drops below the 200 day simple moving average. This is your first warning on the long side to exit and wait for the 200 day to be retaken.
The MACD has a bearish crossover. This shows that the uptrend has lost momentum. This is a warning sign that the market could fall as price settles out of an uptrend and into a trading range.
The VIX starts to go over 20 and stay there.
Price starts to trade under the 5 day EMA.
The 10 day EMA starts to be intraday resistance.
Even strong rallies fail at the 21 day EMA.
Consistent lower highs and lower lows.
The average true range (ATR) increases with volatility during downtrends.
Down volume days are higher than up volume days.
Most of your long side positions start to lose money consistently and you find yourself profitable selling short not only rallies but dips.