Showing posts with label Trading Method. Show all posts

Monday, December 5, 2016

Trading Methods, Systems, and Plans

trading-methods-plans
Do You Know the Difference Between Trading Methods, Systems, and Plans?
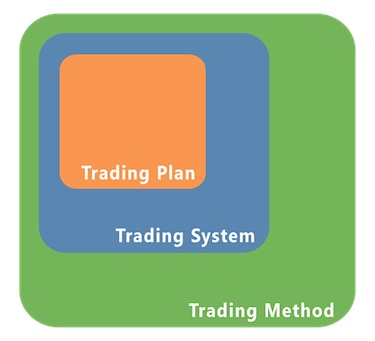
There are significant differences between trading methods, trading systems, and trading plans. These variations can be confusing for new traders, but it is important that students of the market understand and develop these areas in order to optimize their chance of success.
Trading Method
A trading method is the overall process and trading style that is used to profit from the markets. A trading method can be defined as principles used to successfully trade in the stock market, options, forex, futures, or bonds. These operating principles are based on the belief of long term profitability and increased value of trading capital. Traders using different systems and different plans can use the same methodology. Methodology is based on the specific style of trading, with some examples being:
  • Technical Analysis
  • Trend Following
  • Value Investing
  • Momentum Trading
  • Growth Investing
  • Swing Trading
Trading System
A trading system is a set of rules that quantifies buy and sell signals, as demonstrated by successful testing on price history or chart studies. A trading system is the specific kind of data or knowledge used to execute the trading method, based on price action or fundamental valuations. These signals are triggered by measurable technical indicators or key levels on charts. Trading systems have specific parameters relating to position sizing that manage risk and increase the probability of profitability over time. A trading system has at least eight quantifiable elements:
  1. Entry signal
  2. Exit signal
  3. Winning percentage
  4. Risk to reward ratio
  5. Position sizing parameters
  6. Frequency of trading opportunities
  7. Average expected annual return
  8. Maximum expected drawdown
Trading Plan
A trading plan is a set of rules, consistent with a trader’s chosen methodology and system that govern how trades will be executed in real-time. These rules determine what will happen based on the trading system’s entries and exits, risk management, and psychology. The trading plan is meant to keep the trader disciplined and safe from their own weaknesses, while providing the parameters for consistent profitability.
Understanding the difference between methodology, system, and plan is essential to organizing and implementing trades at the right levels. As traders turn research into beliefs, trading methods will become their religion, trading systems will become their bible, and their trading plan will allow them to walk in faith every day.

Tuesday, September 20, 2016

3 Pillars of Trading Performance

As an active trader, there are 3 key factors of your strategy that you need to pay close attention to. There’s no holy grail in trading, but tweaking and maximizing these 3 things can get you pretty damn close to one.
We refer to these factors as the 3 pillars of trading performance:3 Pillars of Trading PerformancePillar #1 – Edge
Edge is a concept that decades of trading literature have beaten to a pulp. You’ve heard it a million times:
“You need a positive edge to win long-term.”
And it’s absolutely true.
In trading, edge is your ability to select trades that perform better than random.
You can think of edge as the process used to generate and execute entry and exit signals. Professional traders spend a majority of their time on this process alone.
They’re constantly asking themselves questions like:
How can I refine my research to enter the absolute best fundamental plays?
How can I better time my exits and entries using quantitative cues?
How can I cut my losses through improved exit parameters?
The more they improve their entry and exit signals, the stronger their edge becomes.
To increase your own edge, relentlessly search for holes to plug in your trading process. This could involve a stronger focus on improving your fundamental analysis. Or maybe refining your profit taking approach. It could also mean tighter risk management or really any number of other factors that go into an effective trading strategy.
The stronger your edge, the more profitable you’ll be.
Pillar #2 – Frequency
Frequency refers to the amount of times your edge expresses itself in the market.
HFT firms may see a million opportunities a day to exploit their edge.
A deep value manager, on the other hand, may only see his edge show up a few times a year.
Frequency matters because the more opportunities you have to apply your edge, the higher your earning potential that year. Ideally you want to apply your edge as many times as possible.
But of course keep in mind that the optimal frequency will differ between strategies. If you expect to increase the frequency of your deep value strategy to a million opportunities a day, you’re out of your mind. At that point you’ll be investing in everything and anything, with concept of “value” thrown out the window.
This is where frequency can become a double-edged sword. The key is to increase it in a way that does not degrade edge.
Few people think about the trading process from the frequency angle. They tend to focus only on cultivating an edge, but never give any thought to how often that edge can be executed.
Look at your own trading process.
What type of edge are you developing?
Is its frequency optimal for your particular strategy?
For example, if you’re a deep value investor, are you looking at as many markets as you could be to find the best deals? If you’re only investing in US equities, would a trip into the foreign markets increase the frequency of the value propositions you’re able to find?
The more often you apply your edge, the more money you can extract from sweet Mr. Market.
Pillar #3 – Leverage
Leverage, like frequency, is rarely discussed, yet extremely important. It can mean the difference between average and superior performance.
Leverage simply means deploying extra capital above your cash level in the market.
Now a lot of people will tell you that using things like margin to add leverage to your trades is dangerous. And that may well be true for the green-behind-the-ear trader, but proper use of leverage for a professional is essential to their success.
Soros’ Quantum fund would routinely achieve leverage levels of 4 to 1. That means that for every million dollars in their account, Soros and Druck had 4 million in bets out in the market.
Here’s Soros himself on the concept of using leverage:
It is a rather unusual structure, because we use leverage. We position the fund to take advantage of larger trends – and then, within those larger trends we also pick stocks and stock groups. So we operate on many different levels. I think it is easiest if you think of a normal portfolio as something flat or two-dimensional, as its name implies. Our portfolio is more like a building. It has a structure; it has leverage. Using our equity capital as the base, we construct a three-dimensional structure that is supported by the collateral value of the underlying securities. I am not sure whether I am making myself clear.
Let’s say we use our money to buy stocks. We pay 50 percent in cash and we borrow the other 50 percent. Against bonds we can borrow a lot more. For $1,000 we can buy at least $50,000 worth of long-term bonds. We may also sell stocks or bonds short: we borrow the securities and sell them without owning them in the hope of buying them back later cheaper. Or we take positions – long or short – in currencies or index futures. The various positions reinforce each other to create this three dimensional structure of risks and profit opportunities.
If you want to blow the doors off the average performance you see in the market, you need to focus on increasing your leverage as much as possible.
Now the obvious caveat to this statement is that you should never press your leverage to a point where you risk bankruptcy. A proper risk management system will tell you the max amount of leverage you can apply per trade without going broke. For example, don’t go trade a 10 lot of E-minis on a $10,000 account. That would not be wise…
Intelligent uses of leverage are critical because they not only increase returns, but they can actually reduce overall portfolio risk too.
Ray Dalio was one of the first investors to popularize this concept (also known as risk parity).
Say Asset A returns 5% a year above the cash rate, with a volatility of 7%.
And Asset B returns 15% a year above the cash rate, but with a volatility of 30%.
Which is the better deal?
If you can’t apply leverage, and you want to make more than 5% a year, then you’re forced to go with Asset B.
But if you understand how to apply leverage, you could easily lever up 3 to 1 (borrow 3 units for every 1 unit you own). This would allow you to buy 4 units of Asset A instead of 1, transforming your returns to 20% a year with 28% volatility — a much better deal than Asset B’s 15% a year with 30% volatility.
Creative uses of leverage in your investment strategy will put you leagues above other investors without leverage.
An Optimization Problem
Once you understand the 3 pillars of trading performance, your goal should be to maximize each.
Maximizing your edge means winning more and winning larger. Maximizing your frequency means applying that edge more often. And maximizing your leverage means juicing your capital base.
But here’s where it gets tricky. You can’t blindly maximize each pillar individually. You’ll end up destroying your strategy and landing yourself in the poorhouse.
The problem is that each pillar affects the other. Adjusting one leads to a change in another one.
Say for example you decide to lengthen your investment timeframes. You believe higher time frames have less noise and stronger signals.
Great!
You end up increasing your expected value per trade through a larger edge. But before you run off to raise a few hundred million, you need to consider what are you’re giving up to achieve that higher edge.
The answer is that you’re giving up your frequency.
If you make $2 a trade on higher timeframe monthly charts, which provide a frequency of 25 trades a year, you’ll make 50 bucks.
But what if that same strategy on lower timeframe daily charts made $.50 a trade, with a frequency of 200 trades a year? The daily program, despite the lower edge (profit per trade) would generate $100 a year in profits. That’s twice the returns of the higher timeframe strategy!
In this case the strategy with the smaller edge actually makes more money per year. This is why those pesky HFT’s do what they do. Yes, smaller timeframes are noisy, making it harder to create a meaningful edge, but if that smaller edge has a higher frequency than a larger edge, then it may actually be optimal.
This is why optimization becomes difficult. You can beef up your edge by adding more criteria or filters to produce a better signal, but by being more selective, you decrease the frequency of your entries.
It may actually not be in your best interest to beef…
You see a similar problem when reversing the frequency/edge relationship.
Say you want to jack up the frequency in which you apply your edge. To do this, you start looking for more and more chart set-ups. But at the same time, you start loosening your trade criteria further and further.
At a certain point you realize that every tea leaf and chart candle has become a trade, and before you know it your trading edge erodes into oblivion.
In this case, increasing frequency hurt you because your edge degraded in the process.
There are even more problems when it comes to leverage optimization.
As we explained before, the goal with leverage is to maximize as much as possible without exposing yourself to bankruptcy risk. There are many different ways to creatively (and safely) do this.
Say for example you have a lukewarm strategy that uses stock and ETFs. And its returns end up being the same as any standard buy-and-hold passive strategy. If this is the case, the strategy isn’t worth it. Might as well throw your money into a Vanguard fund or something.
But here’s where leverage can make all the difference. You may be able to take that same strategy, and instead of using stocks and ETFs, use futures to apply concentrated leverage. All of a sudden you might have something halfway decent on your plate.
Here’s another example. Say your strategy’s entry signals vary in strength.
Sometimes the signal is pure and sexy like the dime standing at the end of the bar. And other times it’s muddled and a little drab, but what the hell, you’ve been in a dry spell lately so it’s still worth your time.
Having the ability to leverage up or down depending on the strength of your signal can lead to much better performance. Your best trades can have the most oomph behind them, while your lesser trades can hang back a bit.
If you’re not thinking about leverage, you need to start. You’re missing out on a crucial pillar that will help juice your performance to Market Wizard heights.
The next time you approach your trading process, go at it with the 3 pillar optimization problem in mind.
Recite these three questions to yourself on a weekly basis:
How can I increase the expected profitability (edge) of each my trades?
How can I optimize my trade frequency?
How can I leverage my current capital?
And when it comes to optimization:
Are the three pillars of my strategy flexible?
If so, can I manipulate one and still come out with a juiced up bottom line?
Start to look at your trading process from a multi-dimensional point of view. Focusing on improving a particular setup or exit methodology is good and all, but that’s just one part of the puzzle. It’s playing a 2-D game. You need to look 3D and beyond…
Think in 3D
How do you approach trading? For our methods click here.

Tuesday, September 13, 2016

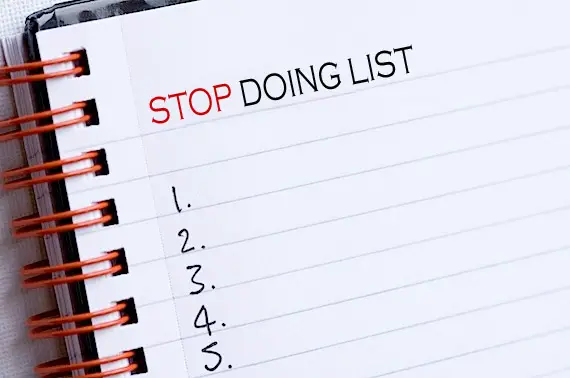
A Stop List for Traders

A Trader's Stop List
  1. Stop breaking your trading rules. Discipline is an edge.
  2. Stop trading such big position sizes. Risk management and self control is an edge.
  3. Stop trying to predict what will happen next and learn how to react to what is happening.
  4. Stop worrying about other’s trades and trade your own system.
  5. Stop thinking every dip will be a crash and every rally will go straight up.
  6. Stop buying junk stocks and quit selling momentum stocks short.
  7. Stop holding a losing trade past your stop loss level.
  8. Stop buying too late in an uptrend and quit selling short too late after a plunge.
  9. Stop trading your opinions and start trading some quantified signals.
  10. Stop being a perma-bull or perma-bear and be a perma-system follower.

Thursday, July 21, 2016

Elements for Building Trading Systems

While trading systems have to be built for an individuals risk tolerance and personality type the principles used to build trading systems are basically the same . Here are the 10 key universal elements to successful trading system development.
  1. You have to chose if your system will be profitable from a high win rate or big wins and small losses.
  2. You must eliminate the possibility of large losses in your trading system through the following risk management tools: stop losses, option contracts, futures contracts, and position sizing.
  3. You have to chose if your trading system will be one that follows the trend or trades price swings. You can have multiple systems in one account.
  4. What will be your signals for capturing trends? Breakouts, moving averages, high or low price in a set number of days, or all tine highs or all time lows.
  5. What will be your swing trade signals? Resistance, support, MACD, Stochastics, or RSI?
  6. What will be your position size per trade?
  7. How will you manage your trade size in relation to volatility?
  8. Risk no more than 1% of total trading capital per trade.
  9. How much open risk will your positions expose you to? 3% max is a good parameter.
  10. What markets will you trade and how will you prioritize your entry signals?

10 Ways to be in the Circle of Profitability

“Stay in the center of the circle, and let all things take their course.” – Lao Tzu
For long term profitability a trader must develop an edge over other traders, and then leverage that edge using discipline. Money comes from a trader’s ability to develop a system of robust entries and exits, and trade it using a plan that incorporates risk management. 
Regardless of what is going on around you in the markets, stay inside your circle of competence as a trader:
  1. Follow your trading plan.
  2. Take your trade entry signals and set ups.
  3. Manage your risk closely.
  4. Cut your losses when you are proven wrong.
  5. Keep trading within your own time frame.
  6. Keep following your own tested system.
  7. Don’t start trading out of fear.
  8. Don’t start to position size based on greed.
  9. If you are on a losing streak, trade smaller not bigger until you start winning again.
  10. Do not let others predictions and opinions influence your trading; trade price action.

Friday, June 24, 2016

Strategy / Method / Algorithm


Flowchart for successful trading

1. Trend analysis


First of all, we have to identify the direction of the actual trend. Generally, I do it on D1 timeframe, but if I can't identify the trend at first glance I jump up on weekly chart.
Usually I try to find obvious higher highs, higher lows (uptrend) or lower lows and lower highs (downtrend). The exponential moving averages EMA(8,21) can help you on D1 timeframe:
  • divergent slope EMAs confirm downtrend
  • divergent rising EMAs confirm uptrend
If it's impossible (without any doubt) to determine the direction of the trend, probably the market is going to form a sideway range trend. I prefer trivial, obvious and strong bullish or bearish directions.

2. Retracements


  • Fibo levels
  • touching 8/21 EMAs
  • key levels (horizontal trendlines)

3. Price Action (PA) setups


  1. Pin bar reversal
  2. Railroad tracks
  3. Inside bar
  4. Inside bar + pin bar reversal
  5. Inside bar + fakey pin bar

1. Pin bar reversal - possible entry setups (for SHORT positions)


2. Railroad tracks pattern - possible entry setups (for SHORT positions)


3. Inside bar pattern - possible entry setups (for SHORT positions)


4. Inside bar + pin bar reversal - possible entry setups (for SHORT positions)


5. Inside bar + fakey pin bar - possible entry setups (for SHORT positions)


Tuesday, April 12, 2016

A Big Obstacle for Traders: Time


Via Celestine Chua Flikr
Day traders can lose money in markets with low volatility.
Trend followers don’t make money without a trend and lose money in whipsawing markets.
Swing traders can’t make money in tight ranges.
Investors lose money in bear markets.
Option buyers need trends to make money, and option sellers need small moves in prices to make money.
If you are trading with a robust system, proven principles, and the right position size then trading can be an enjoyable and profitable experience. If you risk too much and trade too randomly, then trading can be a stressful nightmare. If your trading capital is large enough to meet your financial goals, then you can enjoy it as a sport. If you are trading with a small account and trying to pay the light bill each month, you will experience too much stress to trade with a long-term perspective.
Each trade should be just one of the next one hundred. Each trade you make today should just be one for the week. Each week should only be one week during the month. One month’s results are just one out of the entire year. Short-term results can be random; it takes time for a system to play out and to identify an edge during the right market environments that can lead to profitability.
You have to monitor your trading to ensure that you’re following your system’s entries and exits with discipline, and that you are meeting your win percentage and limiting your losses per your trading plan. Trading is about the long game and the fortitude to last long enough to reap the rewards of your efforts. Time is your test, stay with it until you win. Survival is half the battle. The other half is comprised of discipline, risk management, and a robust methodology.
Time is one of the biggest obstacles that traders will face. Success has more to do with how you manage losing streaks and drawdowns because the winning streaks are easy, but patience is the true test of a professional trader.

Monday, April 11, 2016

How to be a Profitable Trader in 180 Days

This is a guest post by Rayner Teo
how to be a profitable trader
Let me guess.
You’re into trading because you want financial freedom, to make lots of money, and to kiss your boss’s as* goodbye.
You learn everything you can get your hands on. Trading books, courses, forums etc.
1 year has passed…
2 years has passed…
3 years has passed…
And you’re still not profitable.
The bad news is this:
Chances are, you don’t know what it takes, to succeed in this business.
And the good news?
I’m going to show you how to be profitable, step by step, within the next 180 days.
Let’s begin.

The law of large number and how it impacts your trading

First, you need to understand something called “the law of large number”.
So, what is the law of larger number?
The law of large numbers is a theorem that describes the result of performing the same experiment a large number of times. According to the law, the average of the results obtained from a large number of trials should be close to the expected value, and will tend to become closer as more trials are performed. – Probability Theory
And what does it mean?
This means you need a large number of trades (at least a 100) for your “edge” to play out.
It’s impossible to be consistently profitable every week, taking 7 trades a month.
Because your trading results are random in the short run, and will be closer to its expected value, in the long run.

What is consistency?

Now…
For your “edge” to play out, you need a minimum of 100 trades, for the law of large number to work in your favor.
This means:
If you want to be profitable every day, you need 100 trades a day.
If you want to be profitable every week, you need 100 trades a week.
If you want to be profitable every month, you need 100 trades a month.
So…
Let’s breakdown some of the trading approach you can employ.
High frequency trading – Trading at 10,000 times a day, you can expect to be profitable everyday, like Virtu Financial.
Day trading – Trading an average of 3 – 5 times a day, you can expect to be profitable in most quarters.
Swing/position trading – Trading an average of 5 – 15 times a month, you can expect to be profitable in most years.
The more trades you put on during a shorter period of time, the faster your “edge” will play out.
But without an “edge” in the markets, the more trades you put on, will lead you to blow up your account faster.
Understand this, and you’re ahead of 90% of traders out there.
Next…
I will share with you the exact steps on how to be consistently profitable.

Find a trading style that suits you

The best way to find out is, to read Market Wizards, by Jack Schwager.
You’ll be exposed to different trading styles by successful traders, and learn the essentials of what it takes to be a, consistently profitable trader.
Once you find a trading style that resonates with you, go all out and learn everything you can on it. (Let’s assume you want to be a successful swing trader).
Here’s how:
Books – Go to Amazon, and read books on “Swing trading”. I would suggest sticking to books with 4 stars or higher
Youtube – Watch videos on swing trading, and look for channels to subscribe to
Google – You can always find hidden gems here. Search for topics on “swing trading” and you’ll be amazed at the wealth of information available
Social Media – A gold mine here to learn from experienced traders
As you acquire trading knowledge, I would encourage you to write it down, or save it in a word document. This is to track what you’ve learnt, and to find out “the stuff” that resonates with you.
This should take you no more than 28 days.
Now…
You’re going to use these new found knowledge, and develop your own trading plan.
Are you ready?

A step by step guide to developing your trading plan

A trading plan is a set of guidelines that define your trading.
The benefits of a trading plan:
  • Removes subjectivity in your trading
  • Reduce “roller coaster” experiences
  • Keeps you focus on your trading goals
  • Allows you to identify “problems” to work on
  • Prepares you for the “worst” possible scenario
Now you’re probably wondering:
How do I develop a trading plan?
By answering these 7 questions…
What is your time frame?You must define the time frames you’re trading. If you’re a swing trader, then you’ll probably be trading the 4 hour or daily time frames.
What markets are you trading?You need to state which markets you’ll be trading. It could be equities, forex, futures etc.
How much are you risking on each trade?This boils down to risk management. You must know how much you’re prepared to lose on a single trade. For starters, I would suggest no more than 1%. This means if you have a $10,000 account, you cannot lose more than $100 on each trade.
What are the conditions of your trading setup?You need to know the requirements of your trading setup. Whether you’ll trade with the trend, within a range, or both (For starters I would suggest trading with the trend).
How will you enter your trade?You could enter on a pullback or breakout. Will it be a limit, stop or market order?
Where is your stop loss?
No professional trader would enter a trade without a stop loss. The first thing you need to ask yourself is, “where will I get out if I’m wrong?”
Where is your profit target?
And if price moves in your favor, you need to know where to take your profits.
Disclaimer: Below is a sample trading plan that I came up with randomly, please do your own due diligence.
Sample trading plan
I’ll be using the IF-THEN syntax in my trading plan.
Example:
If I’m a boy, then I’ll wear pants.
If I’m a girl, then I’ll wear skirt.
If I’m not a boy or a girl, then I’ll be naked.
You get my point.
Let’s begin…
If I am trading, then I will only trade Eurusd and Audusd. (The markets you are trading)
If I’m trading currencies, then I’ll focus on the daily charts (Time frame traded)
If I place a trade, then I will not lose more than 1% of my account. (Your risk management)
If price is above 200 EMA on daily, then the trend is bullish. (Conditions before entering a trade and time frame you are trading)
If trend is bullish, then identify area of support where price could retrace to. (Conditions before entering a trade)
If price retrace to your area of support, then wait for a higher close. (Conditions before entering a trade)
If price closes higher, then enter long at next candle open. (Entry)
If you’re long, then place your stop loss below the low of the candle, and take profit at swing high. (Exit when you’re wrong, and when you’re right)
Developing your trading plan should take you not more than 2 days.

Execute your trading plan to be a consistent trader

Once you’ve completed your trading plan, its time to take it to the markets.
I would suggest starting really small on a live account because you’re going to suck, real bad.
And if that’s the case, why not pay lesser in “tuition fees”, to Mr Market?
Now…
When you execute your trades, 1 of 5 things can happen.
  1. Break even
  2. A small win
  3. A big win
  4. A small loss
  5. A big loss
If you eliminate #5, you are much closer to being a profitable trader.
Now…
You must execute your trades consistently according to your trading plan.
Because if you’re entering trades based on how you feel, instead of following your plan, then it would be impossible to tell whether your trading has an “edge” in the markets.
Secondly…
You cannot change your trading plan after a few losing trades. Even though I know you’re tempted to do so.
Why?
Because in the short run, your trading results are random. And in the long run, it’ll be closer towards its expected value.
This means you need a minimum of 100 trades, before coming up with a conclusion whether your trading plan works, or not. Recall the law of large number?
You should be able to execute 100 trades within the next 150 days.
Focus on whether what you are dong is right, not on the random nature of any single trade’s outcome. – Richard Dennis

Record your trades and improve your trading performance

Simply executing your trades isn’t enough.
Because the only metric you get, is your P&L. This doesn’t help improve your trading, except knowing whether you’re making money, or not.
Here’s the metrics you should record:
Date – Date you entered your trade
Time Frame – Time frame you entered on
Setup – Trading setup that trigger your entry
Market – Markets you’re trading
Lot size – Size of your position
Long/Short – Direction of your trade
Tick value – Value per tick
Price in – Price you entered
Price out – Price you exited
Stop loss – Price where you’ll exit when you’re wrong
Profit & Loss in $ – Profit or loss from this trade
Initial risk in $ – Nominal amount you’re risking
R – Your initial risk on the trade, in terms of R. If you made two times your risk, you made 2R.
An example below:
stats

Screen capture your charts

After recording down your metrics, you’d want to save your charts for future reference.
Here’s how you can do it:
  1. Save the chart of the higher time frame
  2. Save the chart that you entered on
  3. Save the chart after the trade is completed

Chart of the higher time frame

This chart will give you the big picture of what’s happening. Depending on your trading style, this chart is usually one time frame above your entry time frame.
E.g. If you’re entering off daily charts, then the higher time frame would be weekly.
In this section, write down your thoughts on the higher time frame like:
  • What’s the trend
  • Support & resistance
  • Structure of the markets
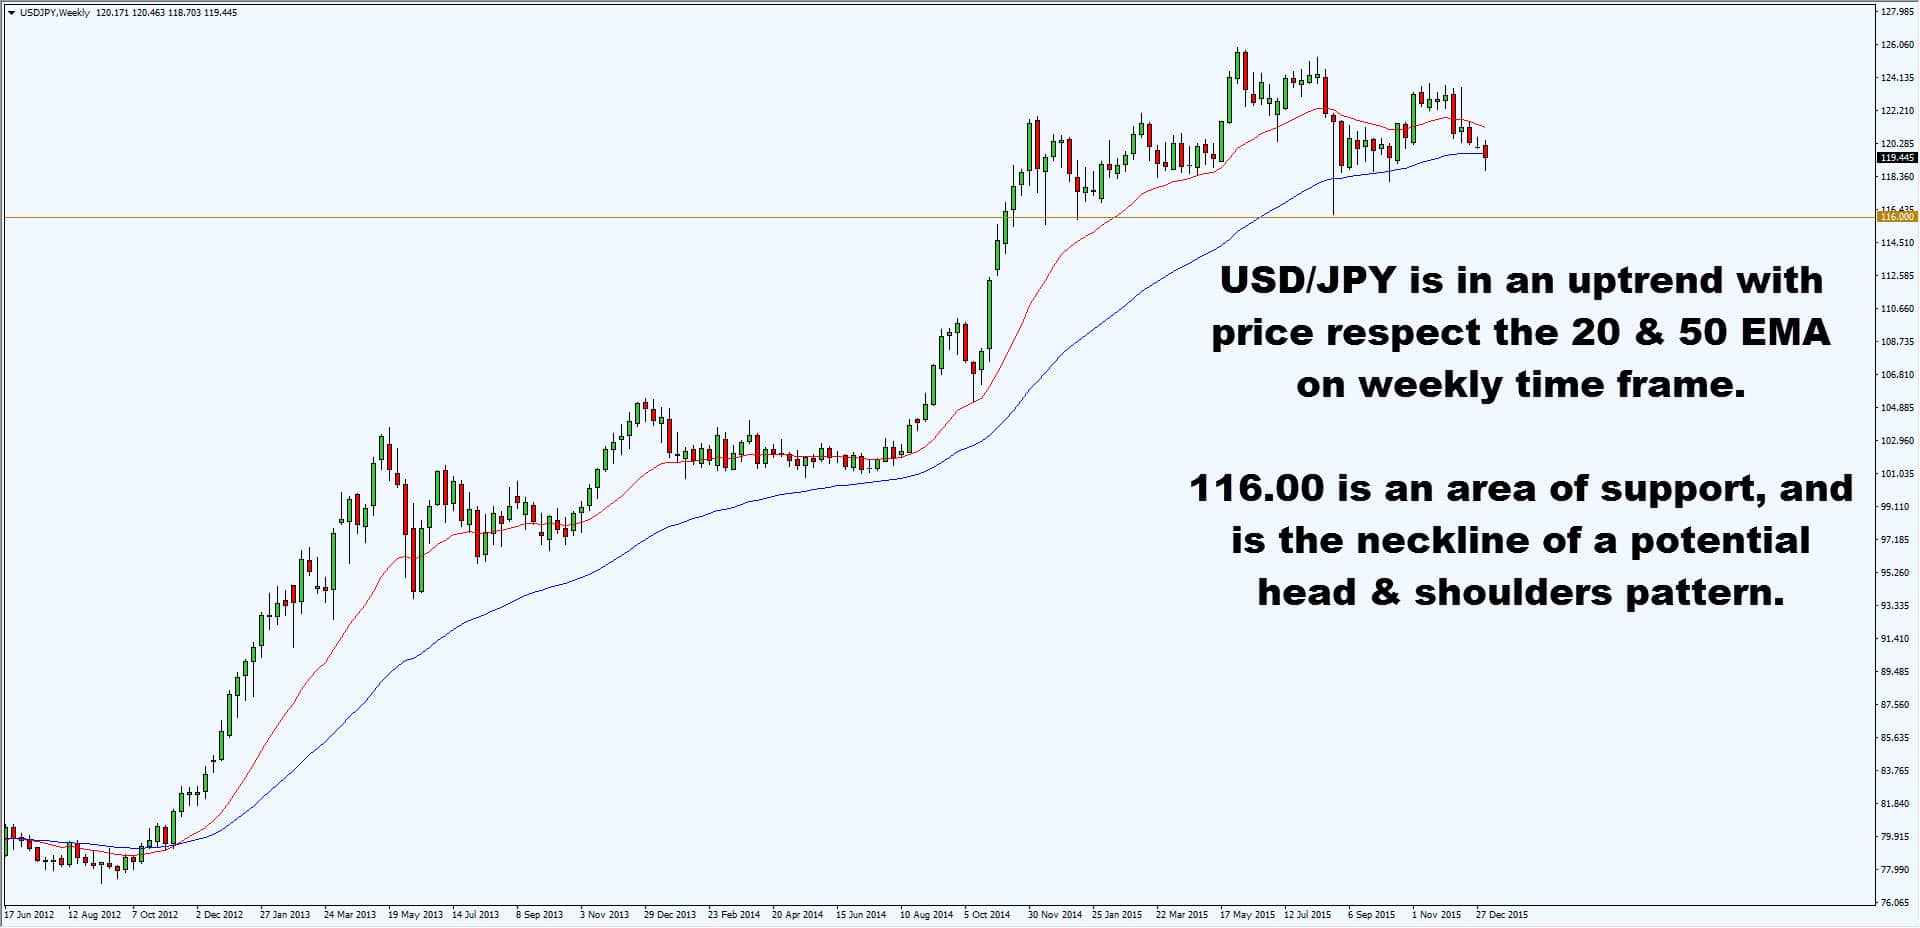
Here’s an example:
higher time frame chart

Chart of the entry time frame

This chart is the time frame you entered on. You’ll mark out the entry and stop loss of your trade.
In this section, write down your thoughts like:
  • What’s the setup
  • Where’s your entry
  • Where is your stop loss
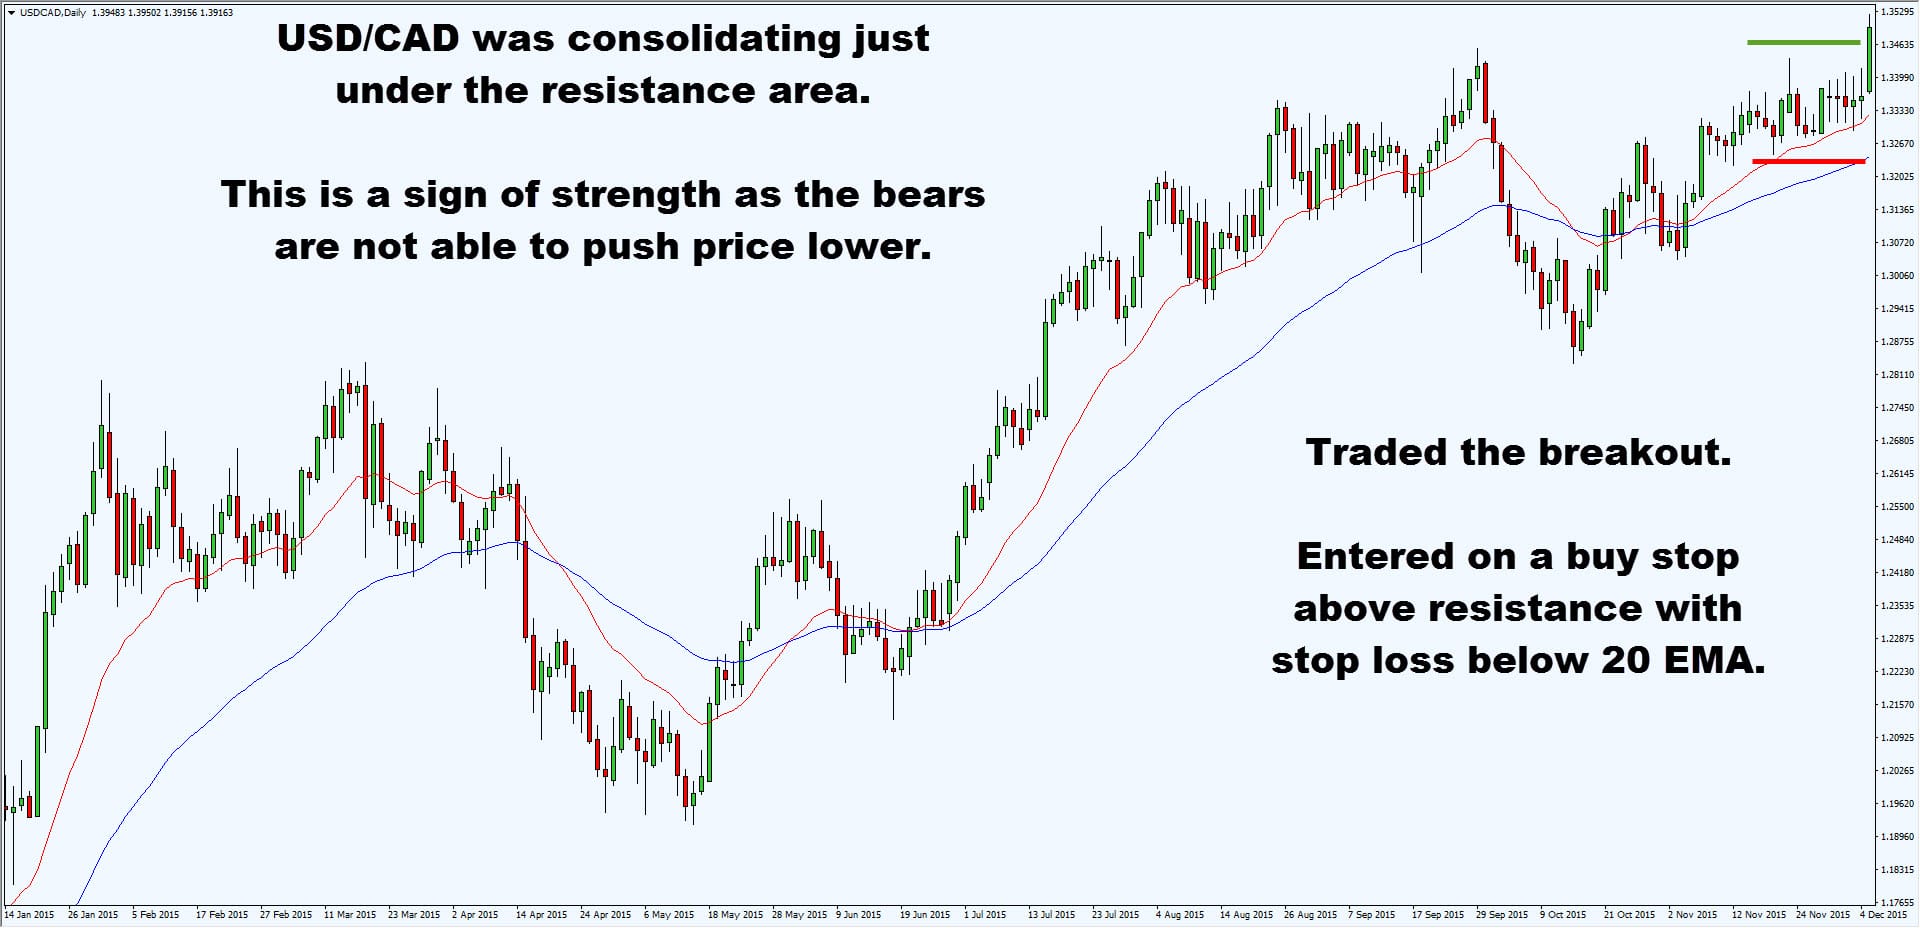
Here’s an example:
entry time frame

Chart after the trade is completed

After completing a trade, you’ll save the chart with your thoughts on it.
In this section, write down your thoughts like:
  • Did you follow your plan
  • What’s your profit/loss in R
  • How did you exit your trade
  • How could you improve on it
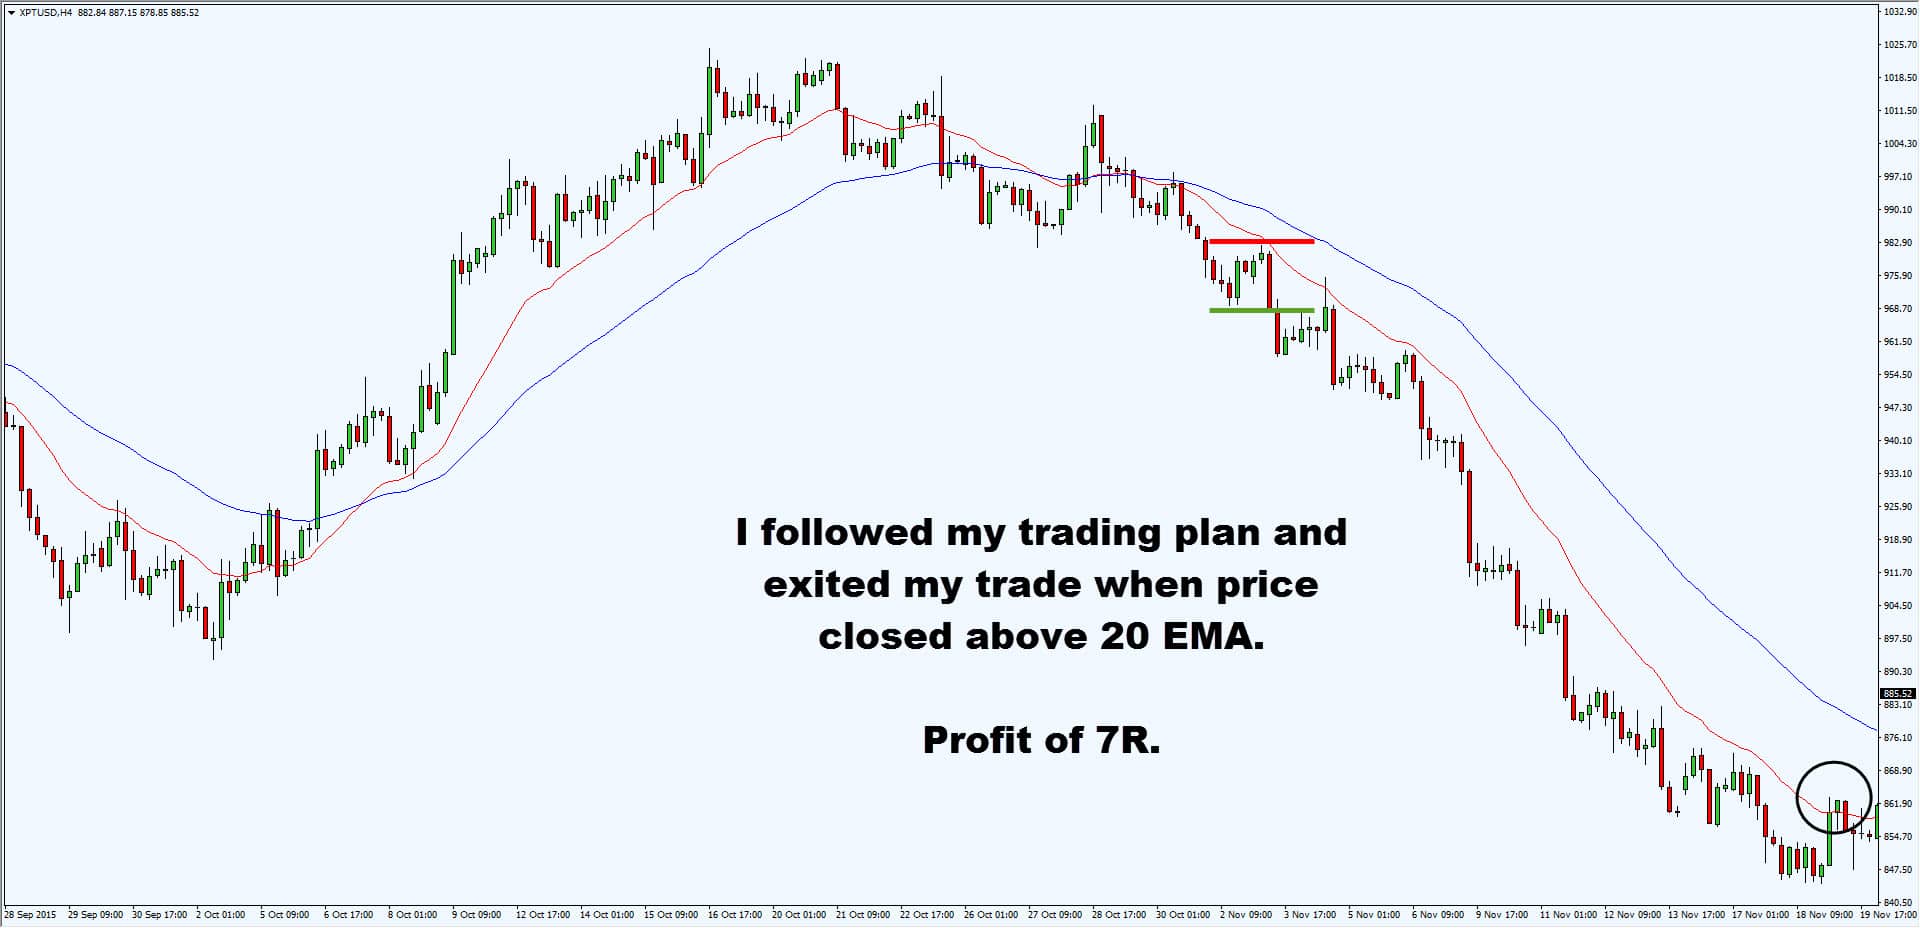
Here’s what I mean:
exit chart
After recording and capturing your charts, you’re now ready to move onto the next section…

Review your trades and find your “edge”

Once you’ve executed 100 trades consistently, you can review whether your trading strategy has an “edge” in the markets.
To do so, you need to use the expectancy formula below:
Expectancy = (Winning % * Average win) – (Losing % * Average loss) – (Commission + Slippage)
If you have a positive expectancy, congratulations! It is likely that your trading strategy has an “edge” in the markets.
But what if it’s a negative expectancy?
Here’s a few things you can look at…
Trade with the trend
By trading with the trend, you’ll trade along the path of least resistance which will improve your performance.
Set a proper stop loss
You want to set your stop loss based on structure of the markets, and not the dollar amount you’re willing to risk.
Remove large losses
You can do this by risking no more than 1% on each trade.

Here’s a summary of what you’ve learnt so far…

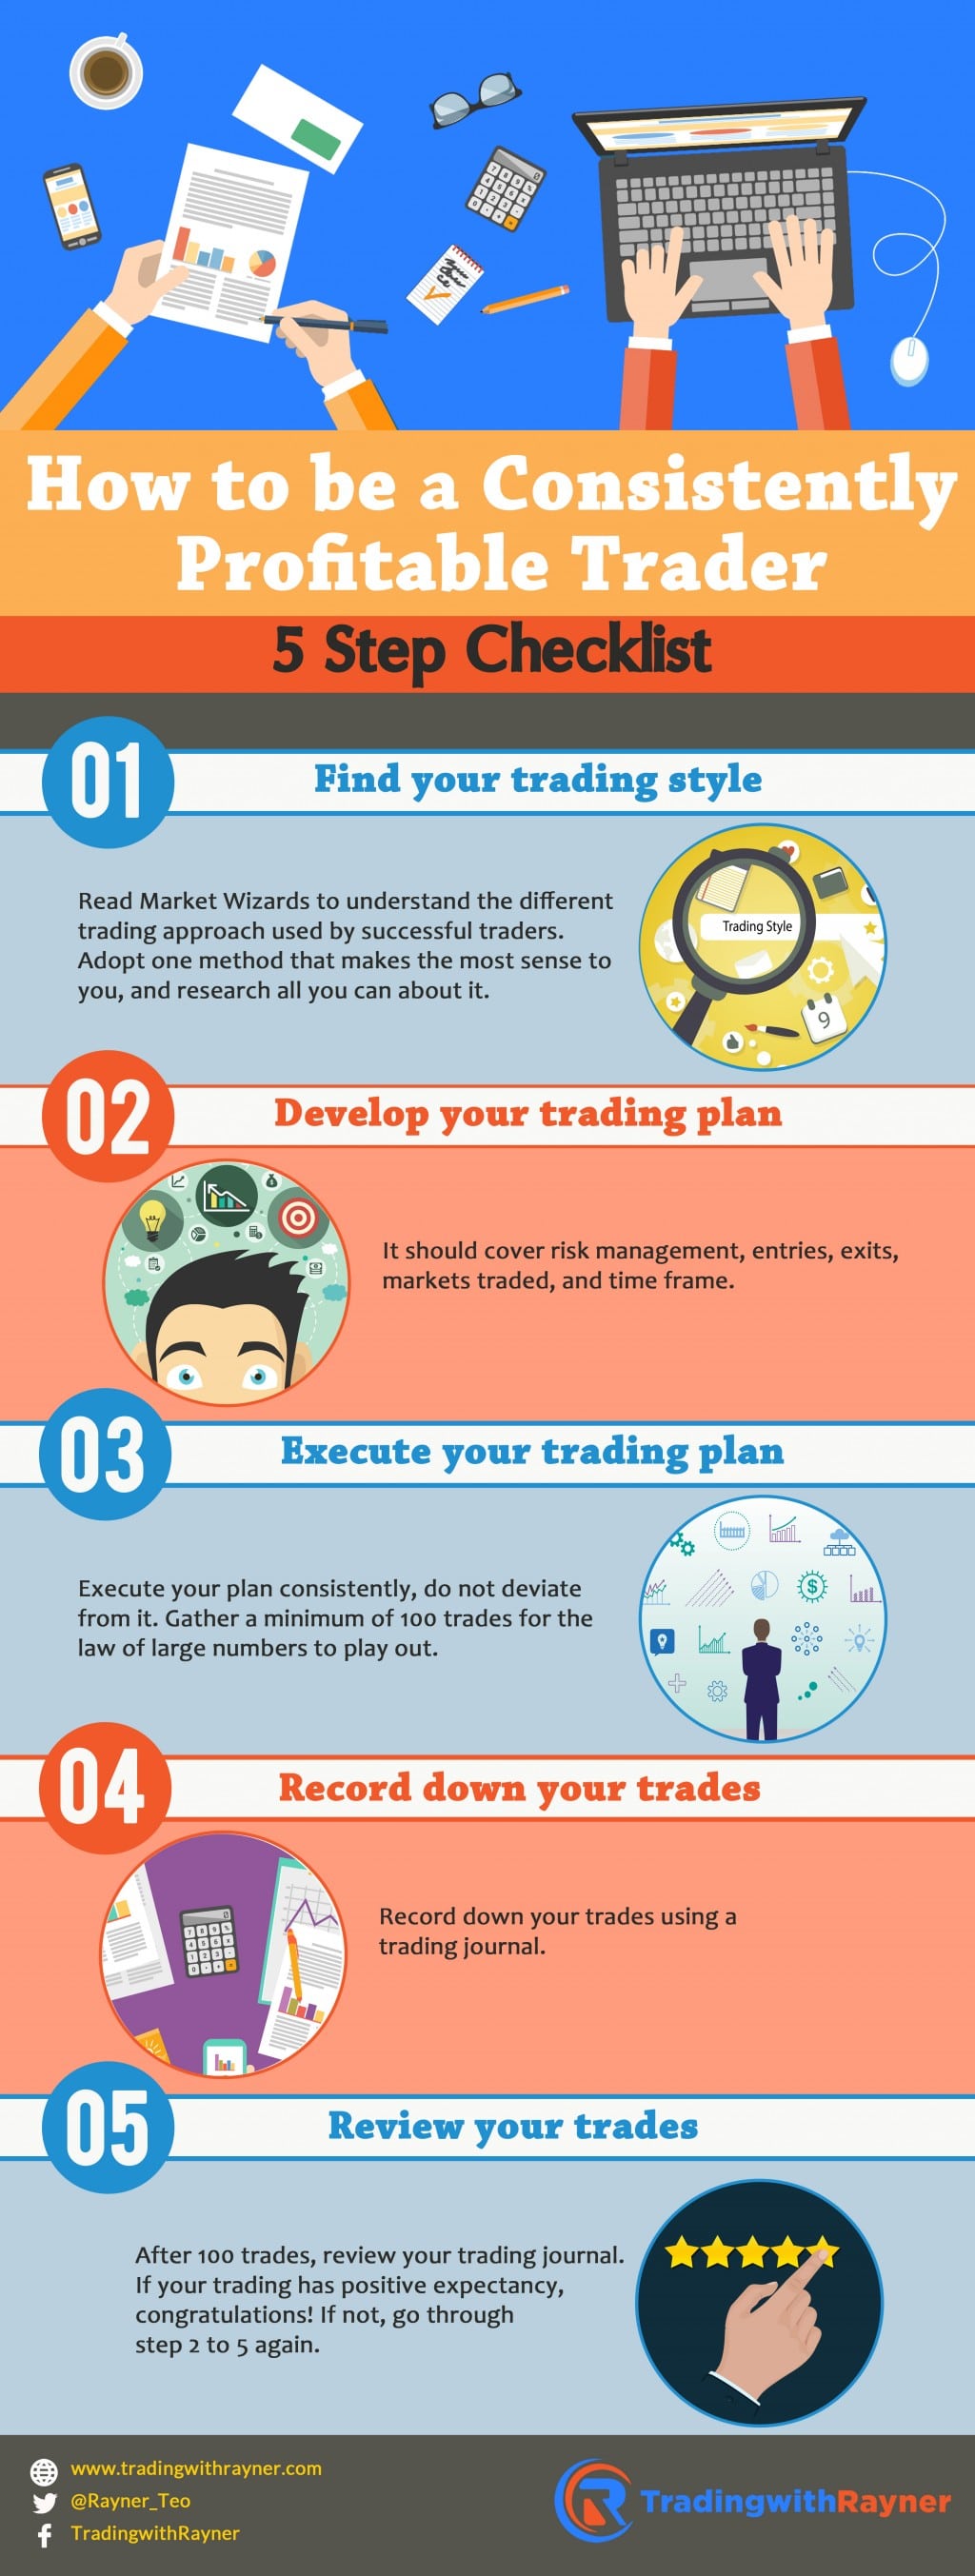
Consistently profitable trader checklist

Speed your learning curve by following these traders

Jim Rohn once said, “you are the average of the 5 people you spend the most time with.”
I couldn’t agree more.
So, if you want to improve your trading fast, then hang around with traders who are already doing it, successfully.

Follow these traders on Twitter:

Steve Burns – Trend and swing trader
Tom Dante – Futures trader (ledge)
Rolf – Founder of Tradeciety
Assad Tannous – Head Trader and founder of Asenna Wealth Solutions
Lance Beggs – Price action trader
Peter Brandt – 40 year veteran trader who trades using classical technical analysis
Rayner Teo – The one who wrote the post you’re reading now

Trading websites you must check out:

Newtraderu – Helping new traders survive
Tradeciety – Lots of tips and tricks on trading
YourTradingCoach – One of the best price action website out there
ChatwithTraders – Interviews with successful traders
TradingwithRayner – Trend following by reading price action of the markets

Conclusion

I’ve just shared with you step by step, on how to be a profitable trader within the next 180 days.
I can’t guarantee you’ll be profitable within the next 180 days. But if you follow the steps I’ve shared with you, I’m certain you’ll have a strong trading foundation that, greatly increase the odds of your trading success.
Trading success is the sum of small efforts, repeated day in and day out — R Collier
Check out more of Rayner’s work at TradingWithRayner.com or his great tweet stream @Rayner_Teo.